Company Overview: URU Metals Limited (LSE: URU) is an FTSE AIM All- Share listed, headquartered in Canada, is engaged in the exploration and development of mineral resources, primarily in South Africa. The company is actively advancing a portfolio of mineral assets focused on a range of strategic commodities across selected regions. Its primary project, the Zebediela Nickel Project, is situated near Mokopane in the Limpopo province of South Africa. This Report covers the Price Action, Technical Indicators Analysis along with the Support Levels, Resistance Levels, and Recommendations on this stock.
Fundamental Highlights:
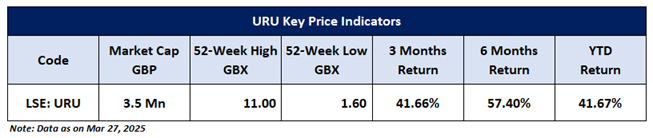
URU Metals Limited demonstrated additional positive momentum in its interim results for the period ended 30 September 2024. The company holds a strong 73.67% ownership stake in Zeb Nickel Corp., reinforcing its control over a key Class 1 nickel sulphide resource. It remains focused on exploring higher-grade nickel zones at the Zeb Project, aligning with rising global demand. Operational efficiency improved, with net cash used in operating activities being reduced to $(11,000) from $(72,000) in the prior period, reflecting tighter cost control. Additionally, the project’s proximity to major operations like Ivanhoe’s Platreef and Anglo American’s Mogalakwena Mine enhances its strategic positioning, while proceeds of $4,000 from loan financing during the period helped sustain project momentum. The company also reported a reduction in total assets to $1,193,000 (31 March 2024: $1,232,000), indicating prudent asset management, while administrative expenses decreased to $(112,000) from $(123,000), reflecting disciplined financial oversight.
URU’s Technical Observation:
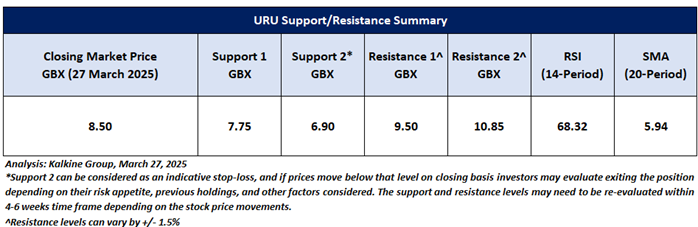
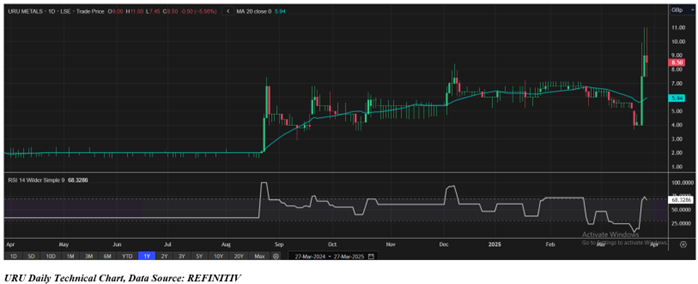
On the daily chart, URU Metals is trading at GBX 8.50, down by 5.56%, yet still holding above the 20-day moving average (GBX 5.94). The recent price surge from the GBX 4.50–5.00 range to a high of GBX 11.00 indicates further bullish momentum probably could continue. The RSI stands at 68.32, approaching overbought territory, but still allowing room for further upside. Price action shows a sharp breakout followed by minor profit booking, which is typical after such strong rallies. If the stock sustains above GBX 7.75, it could attempt to retest the GBX 9.50–10.85 zone in the near term. The rising 20-day MA suggests underlying strength, while higher lows over the past few weeks confirm buying interest on dips. The short-term outlook remains positive as long as it holds above key support levels, with potential for continued gains if momentum persists.

URU’s Daily Chart
As per the above-mentioned price action and technical indicators analysis, a ‘Speculative Buy’ rating has been given on URU Metals Limited (LSE: URU) at the closing market price of GBX 8.50, as of 27 March 2025. Individuals can evaluate the stock based on the support and resistance levels provided in the report in case of keen interest taking into consideration the risk-reward scenario.
Markets are trading in a highly volatile zone currently due to certain Macro & Micro-economic data and prevailing geopolitical tensions. Therefore, it is prudent to follow a cautious approach while investing.
Note 1: Past performance is not a reliable indicator of future performance.
Note 2: Investment decisions should be made depending on an individual’s appetite for upside potential, risks, and any previous holdings. This recommendation is purely based on technical analysis, and fundamental analysis has not been considered in this report. Individuals can consider exiting from the stock if the Target Price or Stop loss mentioned as per the technical analysis has been achieved and is subject to the factors discussed above.
Note 3: Related Risks: This report may be looked at from a high-risk perspective and recommendations are provided for a short duration. Recommendations provided in this report are solely based on technical parameters, and the fundamental performance of the stocks has not been considered in the decision-making process. Other factors which could impact the stock prices include market risks, regulatory risks, interest rate risks, currency risks, social and political instability risks etc.
Note 4: How to Read the Charts?
The Green colour line reflects the 21-period moving average while the red line indicates the 50- period moving average. SMA helps to identify existing price trends. If the prices are trading above the 21-period and 50-period moving average, then it shows prices are currently trading in a bullish trend.
The Black colour line in the chart’s lower segment reflects the Relative Strength Index (14-Period) which indicates price momentum and signals momentum in trend. A reading of 70 or above suggests overbought status while a reading of 30 or below suggests an oversold status.
The Blue colour bars in the chart’s lower segment show the volume of the stock. The volume is the number of shares that changed hands during a given day. Stocks with high volumes are more liquid than stocks with lesser volume as liquidity in stocks helps in easier and faster execution of the order.
The Orange colour lines are the trend lines drawn by connecting two or more price points and used for trend identification purposes. The trend line also acts as a line of support and resistance.
Technical Indicators Defined: -
Support: A level at which the stock prices tend to find support if they are falling, and a downtrend may take a pause backed by demand or buying interest. Support 1 refers to the nearby support level for the stock and if the price breaches the level, then Support 2 may act as the crucial support level for the stock.
Resistance: A level at which stock prices tend to find resistance when they are rising, and an uptrend may take a pause due to profit booking or selling interest. Resistance 1 refers to the nearby resistance level for the stock and if the price surpasses the level, then Resistance 2 may act as the crucial resistance level for the stock.
Stop-loss: It is a level to protect against further losses in case of unfavorable movement in the stock prices.
The reference date for all price data, currency, technical indicators, support, and resistance levels is 27 March, 2025. The reference data in this report has been partly sourced from REFINITIV.
Abbreviations
CMP: Current Market Price
SMA: Simple Moving Average
GBP: British pound sterling
GBX: British pence sterling
RSI: Relative Strength Index
USD: United States dollar
Note: Trading decisions require a thorough analysis by individuals. Technical reports in general chart out metrics that may be assessed by individuals before any stock evaluation. The above are illustrative analytical factors used for evaluating stocks; other parameters can be looked at along with additional risks per se. Past performance is neither an indicator nor a guarantee of future performance.

 Please wait processing your request...