This report is an updated version of the report published on 17 November 2025 at 08:38 AM GMT
Company Overview:
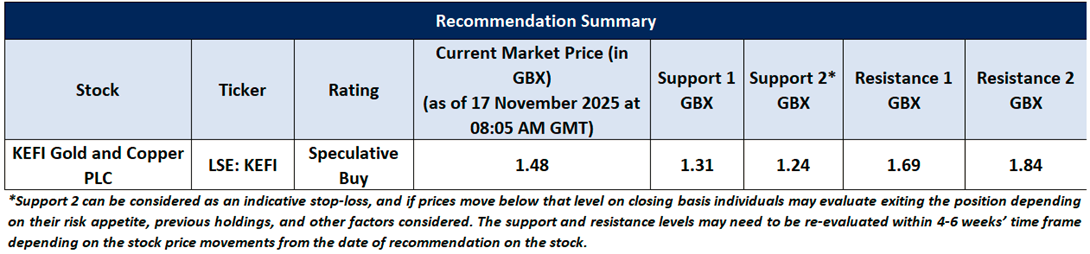
KEFI Gold and Copper PLC (LSE: KEFI)
KEFI Gold and Copper PLC (LSE: KEFI) is a FTSE AIM All-Share listed gold exploration and development entity with projects in the Kingdom of Saudi Arabia and the Federal Democratic Republic of Ethiopia.
This Report covers the Price Action, Technical Indicators Analysis along with the Support Levels, Resistance Levels, and Recommendations on this stock.
Fundamental Highlights:
- Major Financing Milestones Position Tulu Kapi for Execution: The near-completion of the US$340 million financing package — with debt commitments approved by co-lender boards and equity proposals exceeding requirements — demonstrates significant de-risking of the Tulu Kapi project and strengthens confidence in KEFI’s ability to move into full development in October 2025.
- Strengthened Balance Sheet and Reduced Losses Support Improved Financial Stability: The Company’s reduced interim loss, lower administrative expenses, and substantial increase in net assets to £41 million act as indicators of improving financial discipline. These trends suggest the business is becoming more efficient while progressing major development programmes.
- Material Resource Upgrades Enhance Growth Potential in Saudi Arabia: KEFI would view the upgraded mineral resources at Hawiah, Al Godeyer, and Jibal Qutman — along with expanded licence areas — as decent validation of KEFI’s exploration strategy. These developments broaden the Company’s long-term production pipeline and reinforce its strategic position in a rapidly developing Saudi mining sector.
KEFI’s Technical Observation:
KEFI’s daily chart indicates that prices are holding above a key horizontal trendline support zone, suggesting stability in the current structure. The 14-period RSI is near 53.53, reflecting improving momentum without being overstretched. Prices are also positioned above the 50-period Simple Moving Average (SMA), which continues to offer near-term support. Overall, the technical setup remains constructive, pointing to the potential for continued strength as long as prices sustain above these support levels.

KEFI’s Daily Price Chart
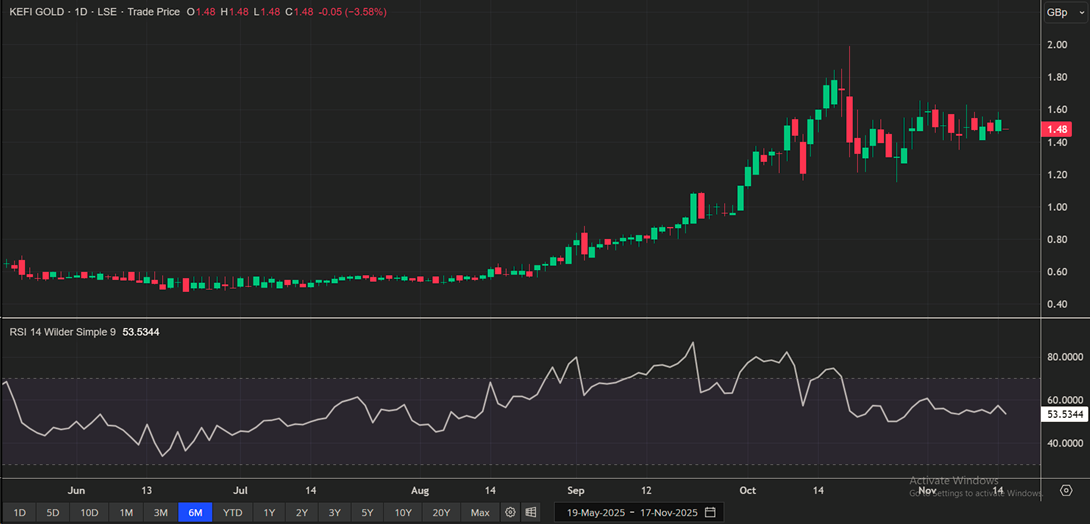
KEFI Daily Technical Chart, Source - Refinitiv
As per the above-mentioned price action and technical indicators analysis, a ‘Speculative Buy’ rating has been given KEFI Gold and Copper PLC (LSE: KEFI) at the Current market Price of GBX 1.48, as on 17 November 2025 at 08:05 AM GMT.
Individuals can evaluate the stock based on the support and resistance levels provided in the report in case of keen interest taking into consideration the risk-reward scenario.
Markets are trading in a highly volatile zone currently due to certain Macro & Micro-economic data and prevailing geopolitical tensions. Therefore, it is prudent to follow a cautious approach while investing.
Note 1: Past performance is not a reliable indicator of future performance.
Note 2: Investment decisions should be made depending on an individual’s appetite for upside potential, risks, and any previous holdings. This recommendation is purely based on technical analysis, and fundamental analysis has not been considered in this report. Individuals can consider exiting from the stock if the Target Price or Stop loss mentioned as per the technical analysis has been achieved and is subject to the factors discussed above.
Note 3: Related Risks: This report may be looked at from a high-risk perspective, and recommendations are provided for a short duration. Recommendations provided in this report are solely based on technical parameters, and the fundamental performance of the stocks has not been considered in the decision-making process. Other factors which could impact the stock prices include market risks, regulatory risks, interest rate risks, currency risks, social and political instability risks etc.
Note 4: How to Read the Charts?
The Yellow color line reflects the 20-period moving average. SMA helps to identify existing price trends. If the prices are trading above the 20-period moving average, then it shows prices are currently trading in a bullish trend.
The Purple color line in the chart’s lower segment reflects the Relative Strength Index (14-Period) which indicates price momentum and signals momentum in trend. A reading of 70 or above suggests overbought status while a reading of 30 or below suggests an oversold status.
The Ink Blue color lines are the trend lines drawn by connecting two or more price points and used for trend identification purposes. The trend line also acts as a line of support and resistance.
Technical Indicators Defined: -
Support: A level at which stock prices tend to find support if they fall, and a downtrend may take a pause backed by demand or buying interest. Support 1 refers to the nearby support level for the stock and if the price breaches the level, then Support 2 may act as the crucial support level for the stock.
Resistance: A level at which stock prices tend to find resistance when they are rising, and an uptrend may take a pause due to profit booking or selling interest. Resistance 1 refers to the nearby resistance level for the stock and if the price surpasses the level, then Resistance 2 may act as the crucial resistance level for the stock.
Stop-loss: It is a level to protect against further losses in case of unfavorable movement in the stock prices.
The reference date for all price data, currency, technical indicators, support, and resistance levels is 17 November 2025. The reference data in this report has been partly sourced from REFINITIV.
Abbreviations
CMP: Current Market Price
SMA: Simple Moving Averages
RSI: Relative Strength Index
USD: United States dollar
Note: Trading decisions require a thorough analysis by individuals. Technical reports in general chart out metrics that may be assessed by individuals before any stock evaluation. The above are illustrative analytical factors used for evaluating stocks; other parameters can be looked at along with additional risks per se. Past performance is neither an indicator nor a guarantee of future performance.

 Please wait processing your request...