iShares Russell 1000 ETF
The Fund seeks investment results that correspond generally to the price and yield performance of the Russell 1000 Index, composed of large- and mid-capitalization sectors of the U.S. equity market. The Underlying Index is a subset of the Russell 3000 Index, which measures the performance of the broad U.S. equity market.
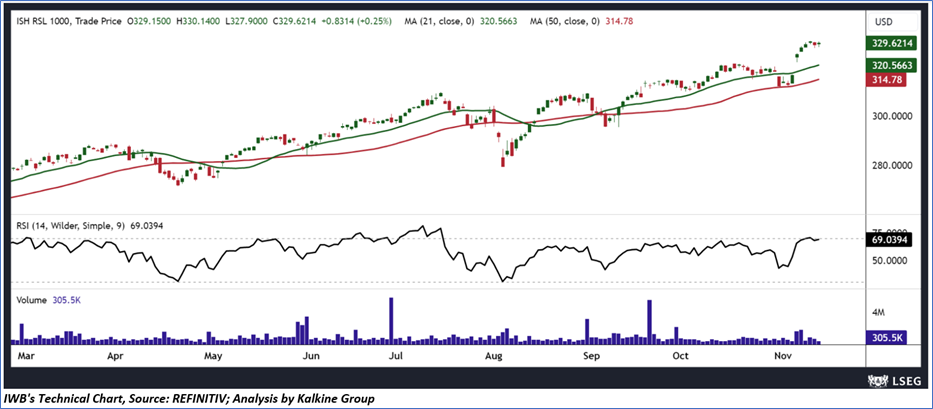
Technical Observation (on the daily chart):
The recent price action of IWB indicates an upward trend, marked by a series of higher highs and higher lows, suggesting a strong potential for continued upward movement in the near term. In this context, it would be prudent to exercise patience and wait for a corrective pullback before entering a long position to capitalize on the expected dip. Furthermore, the 14-day Relative Strength Index (RSI) is displaying signs of being overbought, reflecting a bearish divergence compared to the price action, which could lead to a pullback to alleviate the momentum. Additionally, IWB's price is currently above its 21-day Simple Moving Average (SMA), likely serving as a temporary support level during upcoming fluctuations. This could create a solid foundation for the price to consolidate and then continue its upward trajectory.
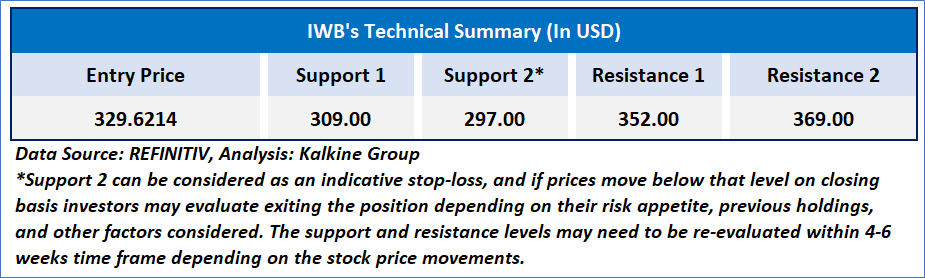
Individuals can evaluate the ETF based on the support and resistance levels provided in the report in case of keen interest taking into consideration the risk-reward scenario.
Markets are trading in a highly volatile zone currently due to certain macro-economic issues and prevailing geopolitical tensions. Therefore, it is prudent to follow a cautious approach while investing.
Related Risk: This report may be looked at from a high-risk perspective and a recommendation is provided for a short duration. This report is solely based on technical parameters, and the fundamental performance of the ETFs has not been considered in the decision-making process. Other factors which could impact the ETF prices include market risks, regulatory risks, interest rates risks, currency risks, social and political instability risks etc.
How to Read the Charts?
The yellow colour line reflects the 21-period simple moving average (SMA) while the blue line indicates the 50- period simple moving average (SMA). SMA helps to identify existing price trends. If the prices are trading above the 21-period and 50-period moving average, then it shows prices are currently trading in a bullish trend.
The black colour line in the chart’s lower segment reflects the Relative Strength Index (14-Period) which indicates price momentum and signals momentum in trend. A reading of 70 or above suggests overbought status while a reading of 30 or below suggests an oversold status.
The red and green colour bars in the chart’s lower segment show the volume of the ETF. The volume is the number of shares that changed hands during a given day. ETFs with high volumes are more liquid than ETFs with lesser volume as liquidity in ETFs helps with easier and faster execution of the order.
The Orange colour lines are the trend lines drawn by connecting two or more price points and used for trend identification purposes. The trend line also acts as a line of support and resistance.
Technical Indicators Defined: -
Support: A level at which the ETF prices tend to find support if they are falling, and a downtrend may take a pause backed by demand or buying interest. Support 1 refers to the nearby support level for the ETF and if the price breaches the level, then Support 2 may act as the crucial support level for the ETF.
Resistance: A level at which the ETF prices tend to find resistance when they are rising, and an uptrend may take a pause due to profit booking or selling interest. Resistance 1 refers to the nearby resistance level for the ETF and if the price surpasses the level, then Resistance 2 may act as the crucial resistance level for the ETF.
Stop-loss: It is a level to protect further losses in case of unfavourable movement in the ETF prices.
Past performance is neither an indicator nor a guarantee of future performance.
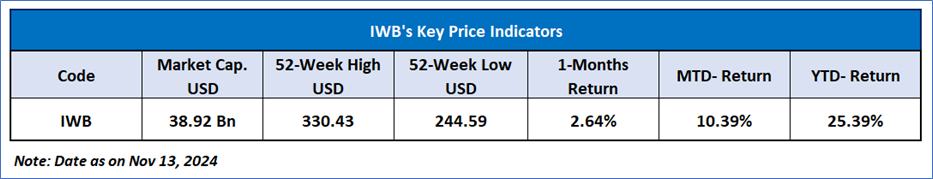
The reference date for all price data, currency, technical indicators, support, and resistance levels is Nov 13, 2024. The reference data in this report has been partly sourced from REFINITIV.
Abbreviations
CMP: Current Market Price
SMA: Simple Moving Average
RSI: Relative Strength Index
USD: United States dollar
Note: Trading decisions require a thorough analysis by individual. Technical reports in general chart out metrics that may be assessed by individuals before any ETF evaluation. The above are illustrative analytical factors used for evaluating ETFs; other parameters can be looked at along with additional risks per se. Past performance is neither an indicator nor a guarantee of future performance.

 Please wait processing your request...