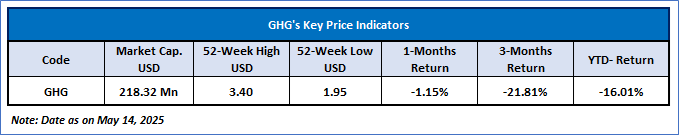
GreenTree Hospitality Group Ltd (NYSE: GHG)
GreenTree Hospitality Group Ltd (NYSE: GHG) is a China-based company principally engaged in the operation of franchised hotels. The Company’s hotel network is mostly comprised of franchised-and-managed hotels. The Company is dedicated to operate mid-scale hotels and its main brand is called GreenTree Inns. The Company operates its business mainly in China.
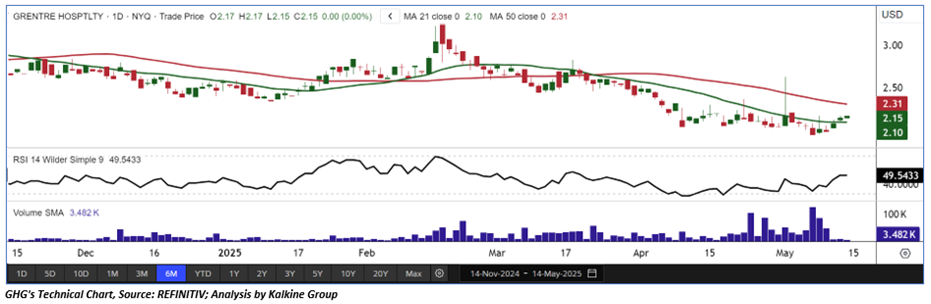
Technical Observation (on the daily chart):
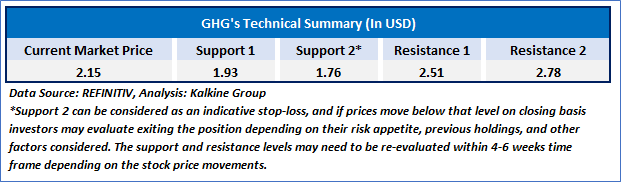
GHG's stock price is currently consolidating within a narrow range following a significant downtrend, and it continues to struggle to break above its key resistance zone, suggesting a potential prolonged period of sideways movement. The RSI hovers around the midpoint, indicating indecision at current levels. Additionally, the stock remains below its declining 50-day SMA, which may serve as near-term resistance. However, if the price manages to reclaim this important moving average, a further upward move toward the resistance area outlined in the table below could be anticipated. The future trend will largely depend on the key support and resistance levels, which will influence supply and demand dynamics.
As per the above-mentioned price action, recent key business and financial updates, momentum in the stock over the last month, and technical indicators analysis, a ‘Watch’ rating has been given to GreenTree Hospitality Group Ltd (NYSE: GHG) at its current market price of USD 2.15 as of May 14, 2025 (8:40 am PDT).
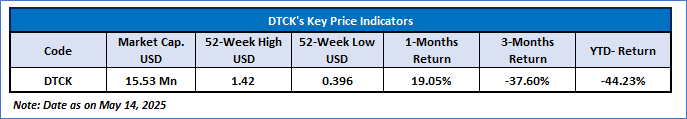
Davis Commodities Limited (NASDAQ: DTCK)
Davis Commodities Limited (NASDAQ: DTCK) is an agricultural commodity trading company. It is engaged in the trading of three main categories of agricultural commodities, namely sugar, rice, and oil and fat products
Technical Observation (on the daily chart):
DTCK's stock price is showing resistance at lower levels and has drifted higher; however, the price is unable to sustain above its previous high points and has experienced selling pressure at the 50-period DMA, indicating a potential period of consolidation in the near term. The RSI remains below the midpoint, further reinforcing a negative bias. Additionally, the stock remains below its declining 50-day SMA, which could act as a near-term resistance. Nonetheless, if the price manages to recover and reclaim this significant moving average, a move higher toward the resistance area outlined in the table below may be expected. The future trend will largely depend on key support and resistance levels, which will influence supply and demand dynamics.
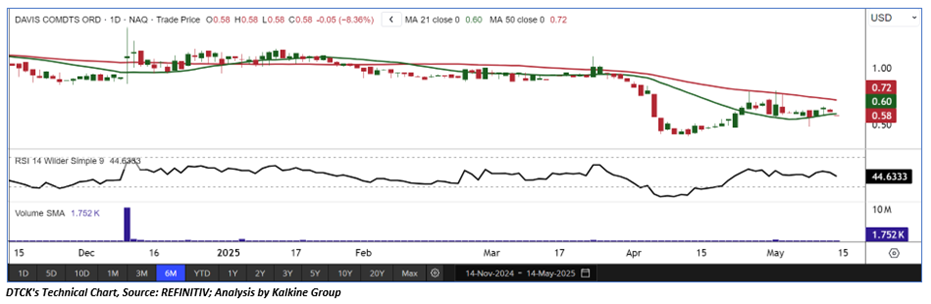
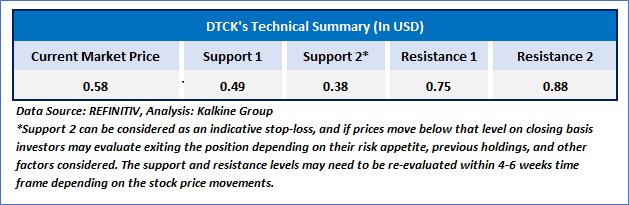
As per the above-mentioned price action, recent key business and financial updates, momentum in the stock over the last month, and technical indicators analysis, a ‘Watch’ rating has been given to Davis Commodities Limited (NASDAQ: DTCK) at its current market price of USD 0.58 as of May 14, 2025 (8:40 am PDT).
Individuals can evaluate the stock based on the support and resistance levels provided in the report in case of keen interest taking into consideration the risk-reward scenario.
Markets are trading in a highly volatile zone currently due to certain macro-economic issues and prevailing geopolitical tensions. Therefore, it is prudent to follow a cautious approach while investing.
Related Risk: This report may be looked at from a high-risk perspective and a recommendation is provided for a short duration. This report is solely based on technical parameters, and the fundamental performance of the stocks has not been considered in the decision-making process. Other factors which could impact the stock prices include market risks, regulatory risks, interest rates risks, currency risks, social and political instability risks etc.
How to Read the Charts?
The green colour line reflects the 21-period simple moving average (SMA) while the red line indicates the 50- period simple moving average (SMA). SMA helps to identify existing price trends. If the prices are trading above the 21-period and 50-period moving average, then it shows prices are currently trading in a bullish trend.
The black colour line in the chart’s lower segment reflects the Relative Strength Index (14-Period) which indicates price momentum and signals momentum in trend. A reading of 70 or above suggests overbought status while a reading of 30 or below suggests an oversold status.
The blue colour bars in the chart’s lower segment show the volume of the stock. The volume is the number of shares that changed hands during a given day. Stocks with high volumes are more liquid than stocks with lesser volume as liquidity in stocks helps with easier and faster execution of the order.
The Orange colour lines are the trend lines drawn by connecting two or more price points and used for trend identification purposes. The trend line also acts as a line of support and resistance.
Technical Indicators Defined: -
Support: A level at which the stock prices tend to find support if they are falling, and a downtrend may take a pause backed by demand or buying interest. Support 1 refers to the nearby support level for the stock and if the price breaches the level, then Support 2 may act as the crucial support level for the stock.
Resistance: A level at which the stock prices tend to find resistance when they are rising, and an uptrend may take a pause due to profit booking or selling interest. Resistance 1 refers to the nearby resistance level for the stock and if the price surpasses the level, then Resistance 2 may act as the crucial resistance level for the stock.
Stop-loss: It is a level to protect further losses in case of unfavourable movement in the stock prices.
Past performance is neither an indicator nor a guarantee of future performance.
The reference date for all price data, currency, technical indicators, support, and resistance levels is of May 14, 2025. The reference data in this report has been partly sourced from REFINITIV.
Abbreviations
CMP: Current Market Price
SMA: Simple Moving Average
RSI: Relative Strength Index
USD: United States dollar
Note: Trading decisions require a thorough analysis by individual. Technical reports in general chart out metrics that may be assessed by individuals before any stock evaluation. The above are illustrative analytical factors used for evaluating stocks; other parameters can be looked at along with additional risks per se. Past performance is neither an indicator nor a guarantee of future performance.
_05_14_2025_17_16_58_093510.jpg)
 Please wait processing your request...