IonQ, Inc.
IonQ, Inc. (NYSE: IONQ) is engaged in the quantum computing and networking industry, delivering high-performance systems capable of solving complex commercial and research use cases.
Technical Observation (on the daily chart):
IONQ's stock price encountered resistance at its previous swing highs and has declined, suggesting a potential period of consolidation with a bearish bias. The 14-period RSI is oscillating near the midpoint, indicating indecision at current levels. Additionally, the stock is approaching a dip below its 21-day moving average, with a move below the 50-day moving average likely to serve as a support level. Overall, the future direction of the stock will largely depend on these critical support and resistance levels, which will shape the supply and demand dynamics moving forward.
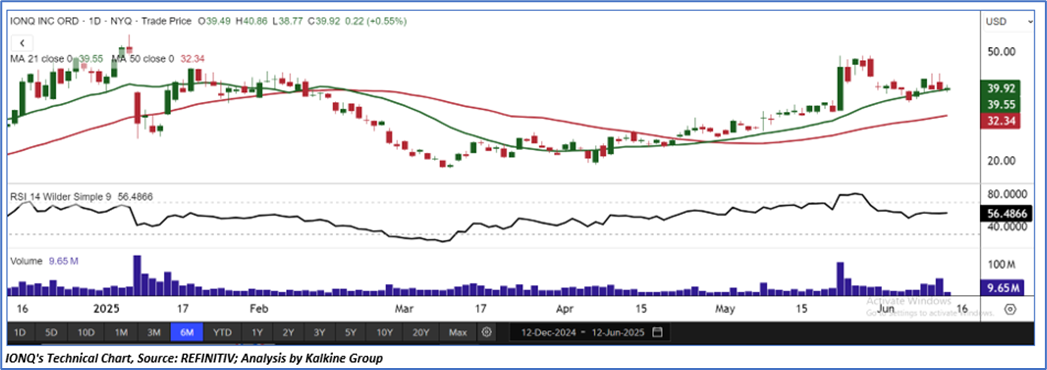
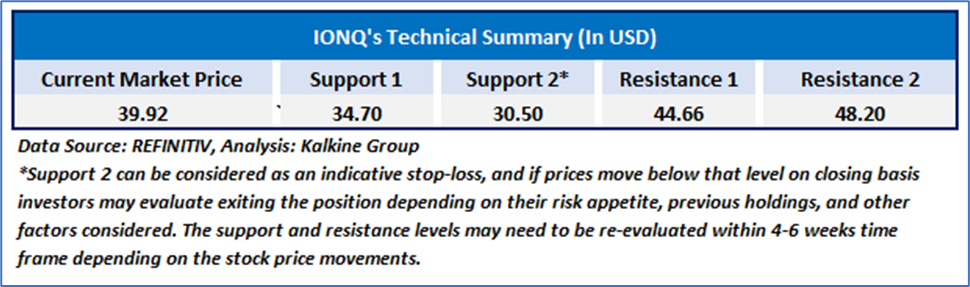
As per the above-mentioned price action, recent key business and financial updates, momentum in the stock over the last month, and technical indicators analysis, a ‘Watch’ rating has been given to IonQ, Inc. (NYSE: IONQ) at its current market price of USD 39.92 as of June 12, 2025 (8:15 am PDT).
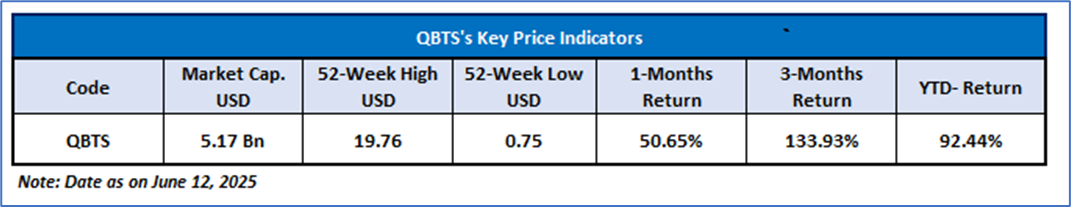
D-Wave Quantum Inc.
D-Wave Quantum Inc. (NYSE: QBTS) is a quantum computing company, which is engaged in the development and delivery of quantum computing systems, software, and services.
Technical Observation (on the daily chart):
QBTS's share price faced resistance at previous peak points and has recently pulled back, implying a possible phase of sideways movement with a bearish tendency. The 14-period RSI remains near the neutral zone, reflecting uncertainty among traders. Furthermore, the stock is nearing a potential breach of its 21-day moving average, and a decline below the 50-day moving average could establish a support zone. Ultimately, the stock's upcoming trend will be heavily influenced by these key support and resistance thresholds, which will impact the buying and selling pressures in the near term.
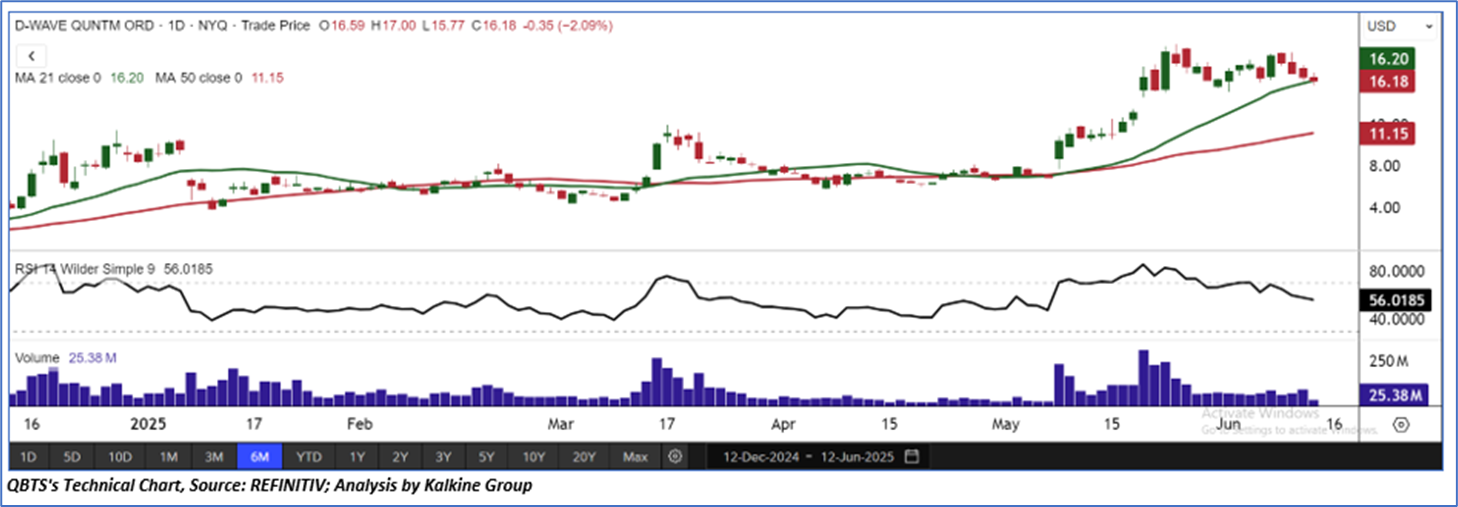
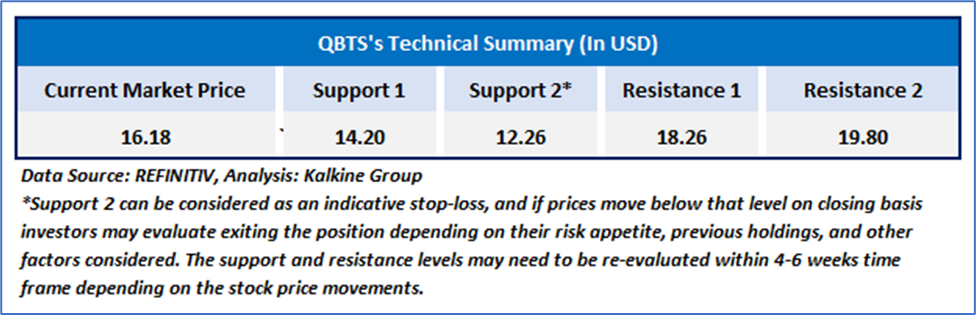
As per the above-mentioned price action, recent key business and financial updates, momentum in the stock over the last month, and technical indicators analysis, a ‘Watch’ rating has been given to D-Wave Quantum Inc. (NYSE: QBTS) at its current market price of USD 16.18 as of June 12, 2025 (8:15 am PDT).
Individuals can evaluate the stock based on the support and resistance levels provided in the report in case of keen interest taking into consideration the risk-reward scenario.
Markets are trading in a highly volatile zone currently due to certain macro-economic issues and prevailing geopolitical tensions. Therefore, it is prudent to follow a cautious approach while investing.
Related Risk: This report may be looked at from a high-risk perspective and a recommendation is provided for a short duration. This report is solely based on technical parameters, and the fundamental performance of the stocks has not been considered in the decision-making process. Other factors which could impact the stock prices include market risks, regulatory risks, interest rates risks, currency risks, social and political instability risks etc.
How to Read the Charts?
The green colour line reflects the 21-period simple moving average (SMA) while the red line indicates the 50- period simple moving average (SMA). SMA helps to identify existing price trends. If the prices are trading above the 21-period and 50-period moving average, then it shows prices are currently trading in a bullish trend.
The black colour line in the chart’s lower segment reflects the Relative Strength Index (14-Period) which indicates price momentum and signals momentum in trend. A reading of 70 or above suggests overbought status while a reading of 30 or below suggests an oversold status.
The blue colour bars in the chart’s lower segment show the volume of the stock. The volume is the number of shares that changed hands during a given day. Stocks with high volumes are more liquid than stocks with lesser volume as liquidity in stocks helps with easier and faster execution of the order.
The Orange colour lines are the trend lines drawn by connecting two or more price points and used for trend identification purposes. The trend line also acts as a line of support and resistance.
Technical Indicators Defined: -
Support: A level at which the stock prices tend to find support if they are falling, and a downtrend may take a pause backed by demand or buying interest. Support 1 refers to the nearby support level for the stock and if the price breaches the level, then Support 2 may act as the crucial support level for the stock.
Resistance: A level at which the stock prices tend to find resistance when they are rising, and an uptrend may take a pause due to profit booking or selling interest. Resistance 1 refers to the nearby resistance level for the stock and if the price surpasses the level, then Resistance 2 may act as the crucial resistance level for the stock.
Stop-loss: It is a level to protect further losses in case of unfavourable movement in the stock prices.
Past performance is neither an indicator nor a guarantee of future performance.
The reference date for all price data, currency, technical indicators, support, and resistance levels is of June 12, 2025. The reference data in this report has been partly sourced from REFINITIV.
Abbreviations
CMP: Current Market Price
SMA: Simple Moving Average
RSI: Relative Strength Index
USD: United States dollar
Note: Trading decisions require a thorough analysis by individual. Technical reports in general chart out metrics that may be assessed by individuals before any stock evaluation. The above are illustrative analytical factors used for evaluating stocks; other parameters can be looked at along with additional risks per se. Past performance is neither an indicator nor a guarantee of future performance.

 Please wait processing your request...