Suncor Energy Inc
Suncor Energy Inc. (NYSE: SU) is a Canada-based integrated energy company. The Company's segments include Oil Sands, Exploration and Production (E&P), and Refining and Marketing. Its operations include oil sands development, production and upgrading, offshore oil and gas production, petroleum refining in Canada and the United States and its Petro-Canada retail and wholesale distribution networks, including Canada’s Electric Highway, a coast-to-coast network of fast-charging electric vehicles (EV) stations.
Key Business & Financial Updates
- Strong Financial and Operational Performance in Second Quarter 2024: Suncor generated USD 3.4 billion in adjusted funds from operations and USD 1.4 billion in free funds flow during the second quarter of 2024. The company returned over USD 1.5 billion to shareholders, which included USD 825 million in share repurchases and USD 698 million in dividend payments. This solid financial performance reflects Suncor’s commitment to delivering value to its shareholders through efficient capital management.
- Upstream Production and Refinery Throughput: Suncor achieved strong upstream production of 771,000 barrels per day (bbls/d) during the quarter, alongside a refinery throughput of 431,000 bbls/d. The company successfully executed approximately USD 800 million in turnaround activities, completing them safely, efficiently, and ahead of schedule. These achievements highlight Suncor’s operational reliability and ability to maintain production momentum.
- Record First Half Production and Utilization Rates: In the first half of 2024, Suncor reached record upstream production levels of 803,000 bbls/d, with refinery throughput averaging 443,000 bbls/d. The company also reported upgrader utilization of 94% and refinery utilization of 95%, which included the impacts of major turnaround activities. These high utilization rates reflect Suncor’s strong focus on optimizing its asset performance while maintaining operational excellence.
- CEO’s Perspective on Strong Execution and Future Momentum: Suncor’s President and CEO, Rich Kruger, emphasized the importance of execution and maintaining momentum throughout the second quarter. According to Kruger, Suncor’s high-quality execution of upstream and downstream activities, alongside operational reliability and cost management, positioned the company for continued success. With the majority of 2024’s planned maintenance completed, Kruger expressed confidence in the company’s ability to perform strongly in the second half of the year.
- Financial Highlights of the Quarter: Suncor reported net earnings of USD 1.568 billion (USD 1.22 per common share) for the second quarter of 2024, compared to USD 1.879 billion (USD 1.44 per share) in the same period of 2023. Adjusted operating earnings rose to USD 1.626 billion (USD 1.27 per share), primarily driven by higher crude oil prices and increased Oil Sands sales volumes. The company also achieved strong cash flow provided by operating activities of USD 3.829 billion (USD 2.98 per share), a significant improvement from the previous year.
- Corporate Strategy and Outlook: Suncor remains focused on improving its free funds flow, with a target to grow it by USD 3.3 billion per year by 2026. The company plans to achieve this by lowering costs, increasing upstream production by approximately 100,000 bbls/d, and enhancing downstream reliability. Additionally, Suncor has increased its share buybacks to approximately 75% of excess funds and plans to further increase buybacks when the revised net debt target of USD 8 billion is achieved.
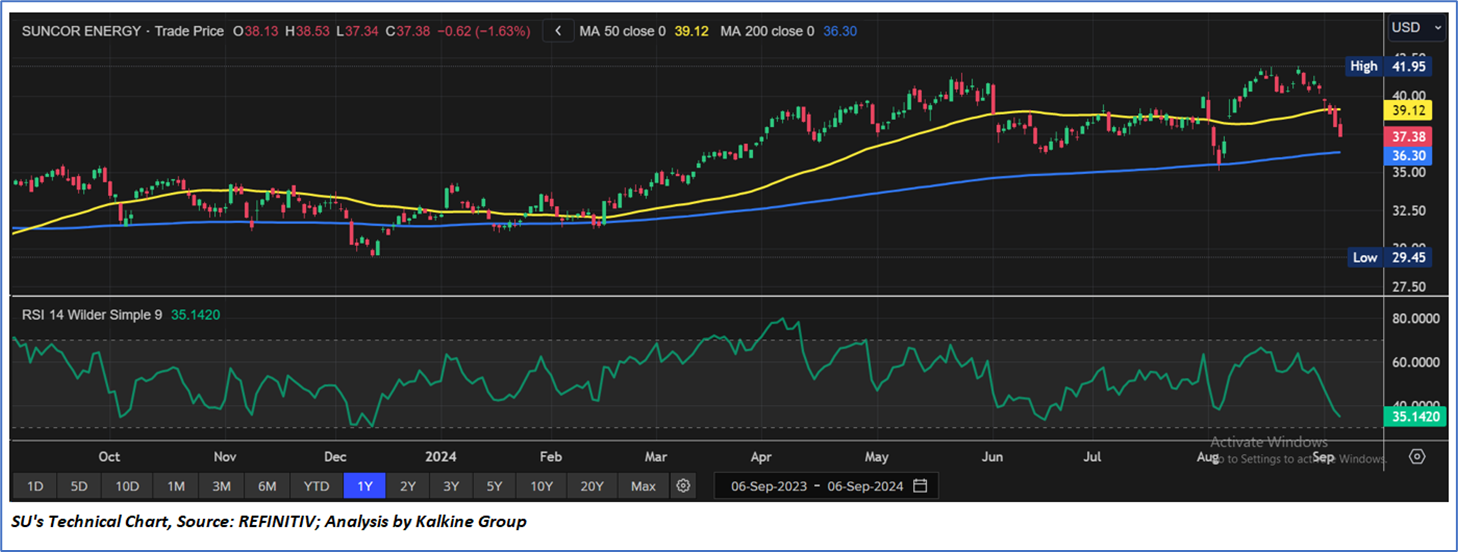
Technical Observation (on the daily chart):
The Relative Strength Index (RSI) for the 14-day period is currently at 35.14, exhibiting a downward movement as it moving towards oversold condition, indicating a potential double bottom or a more correction if USD 26-USD 27 is broken. However, the stock remains positioned between both the 50-day and 200-day Simple Moving Averages (SMA), suggesting potential short- to medium-term resistance and support ahead respectively.

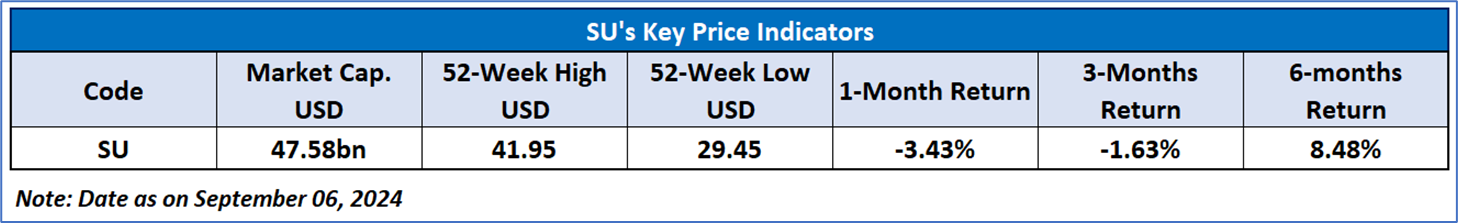
As per the above-mentioned price action, recent key business and financial updates, momentum in the stock over the last month, and technical indicators analysis, a ‘WATCH’ rating has been given to Suncor Energy Inc. (NYSE: SU) at the current market price of USD 37.38 as of September 06, 2024, at 09:45 am PDT.
Individuals can evaluate the stock based on the support and resistance levels provided in the report in case of keen interest taking into consideration the risk-reward scenario.
Markets are trading in a highly volatile zone currently due to certain macro-economic issues and prevailing geopolitical tensions. Therefore, it is prudent to follow a cautious approach while investing.
Related Risk: This report may be looked at from a high-risk perspective and a recommendation is provided for a short duration. This report is solely based on technical parameters, and the fundamental performance of the stocks has not been considered in the decision-making process. Other factors which could impact the stock prices include market risks, regulatory risks, interest rates risks, currency risks, social and political instability risks etc.
Note 1: Past performance is not a reliable indicator of future performance.
Note 2: The reference date for all price data, currency, technical indicators, support, and resistance level is September 06, 2024. The reference data in this report has been partly sourced from REFINITIV.
Note 3: Investment decisions should be made depending on an individual's appetite for upside potential, risks, holding duration, and any previous holdings. An 'Exit' from the stock can be considered if the Target Price mentioned as per the Valuation and or the technical levels provided has been achieved and is subject to the factors discussed above.
Note 4: Target Price refers to a price level that the stock is expected to reach as per the relative valuation method and or technical analysis taking into consideration both short-term and long-term scenarios.s
Note 5: ‘Kalkine reports are prepared based on the stock prices captured either from the New York Stock Exchange (NYSE), NASDAQ Capital Markets (NASDAQ), and or REFINITIV. Typically, all sources (NYSE, NASDAQ, or REFINITIV) may reflect stock prices with a delay which could be a lag of 15-20 minutes. There can be no assurance that future results or events will be consistent with the information provided in the report. The information is subject to change without any prior notice.

 Please wait processing your request...