
Index Update: The FTSE 100 index, a key benchmark index for the London stock exchange, was trading rose around 1.63% on 10 march 2026.
Macro Update: The UK economy is showing cautious growth, with GDP forecasts recently trimmed to 1.1% for 2026 amid geopolitical tensions in the Middle East. While inflation is cooling toward the 2% target, interest rate cuts are stalled. Despite a five-year high in unemployment, manufacturing is rebounding and retail sales remain resilient.
Top Market Movers: Among top gainers on FTSE 100 index, Persimmon PLC (LSE: PSN) witnessed a rise of 6.95% followed by Rolls Royce Holdings (LSE: RR.) which gained around 5.25%.
Commodity Update: The U.S. dollar weakened, losing some of its safe-haven appeal amid speculation that the Middle East conflict may remain limited. Improved risk sentiment supported metals, with gold rising 1.51% to USD 5,181.50, silver surging 5.96% to USD 89.54, and copper gaining 1.17% to USD 13,083.00. Meanwhile, Brent crude fell 6.60% to USD 92.45 after hitting a three-year high earlier, as hopes of easing geopolitical tensions reduced concerns over global oil supply disruptions.
Our Stance: The UK is currently in a phase of fragile recovery. While the economy avoided a deep recession and manufacturing is rebounding, growth remains sluggish at 1.1%. Higher geopolitical risks and a tight labour market mean interest rates will likely stay "higher for longer" to fully anchor inflation.
FTSE 100: The FTSE 100 Index is trading around 10,422.58 on March 10, 2026, up 173.06 points (1.69%), showing a recovery after the recent pullback. The index remains below its 20-day moving average near 10,574.13, while continuing to trade above the 50-day moving average around 10,334.50, which may act as an important technical reference level in the near term. Momentum appears balanced, with the RSI around 47.96, indicating neutral market conditions. On the downside, the 9,900–10,100 zone may act as an immediate support area. Meanwhile, the 10,600–10,900 range could act as a near-term resistance band if the index attempts to extend its recovery.
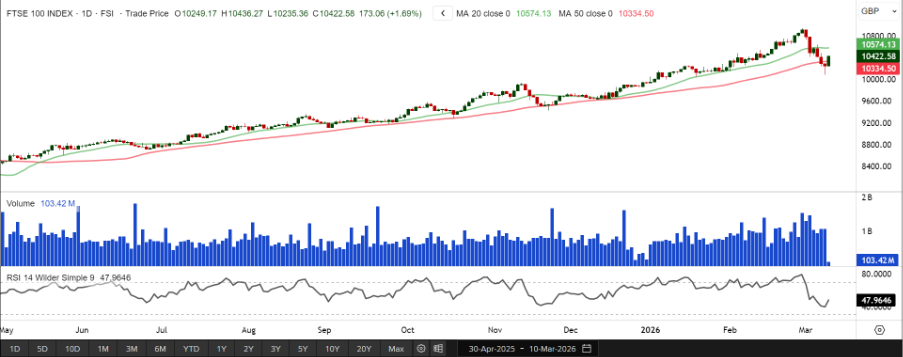
Source: Charts by EODHD/Others


 Please wait processing your request...