
Index Update: The FTSE 100 index, a key benchmark index for the London stock exchange, was trading rose around 1.93% on 01 April 2026.
Macro Update: Global growth remains resilient yet uneven, currently challenged by Middle East volatility and sticky inflation. While the US and India lead, the Eurozone lags. Central banks maintain a hawkish stance as geopolitical risks and AI-driven transitions define this fragile equilibrium.
Top Market Movers: Among top gainers on FTSE 100 index, Compass Group PLC (LSE: CPG) witnessed a rise of 7.22% followed by Rolls Royce Holdings PLC (LSE: RR.) witnessed a rise of 6.54%.
Commodity Update: The U.S. dollar declined on Wednesday as hopes grew that the U.S.-Israel conflict with Iran may prove shorter than initially feared. However, the dollar remained on track for its strongest quarter since the fourth quarter of 2024, supported by lingering safe-haven demand. Gold climbed 0.75% to USD 4,713.50, Brent crude rose 1.56% to USD 105.57, copper gained 0.90% to USD 12,462.90, while silver slipped 0.73% to USD 74.37 during trading.
Our Stance: A cautious yet opportunistic stance favors U.S. equities and Indian growth while hedging energy-driven inflation. Priority remains on quality over growth as hawkish central banks persist, utilizing commodity exposure to buffer against escalating Middle East volatility and systemic supply-chain risks.
FTSE 100: The FTSE 100 Index is currently trading near 10,352.06, up around 1.73%, and has moved back above its 21-day moving average near 10,210.42 while remaining just below the 50-day moving average near 10,352.80. This suggests the recent rebound is strengthening, although the broader structure still faces an important resistance test near current levels. Price action shows a recovery from the decline toward the 9,900 area, with the index now attempting to rebuild upward momentum. The RSI near 54.47 indicates improving momentum and is back above neutral levels. Support is seen around 10,200–10,000, while 10,500–10,650 may act as the next resistance zone.
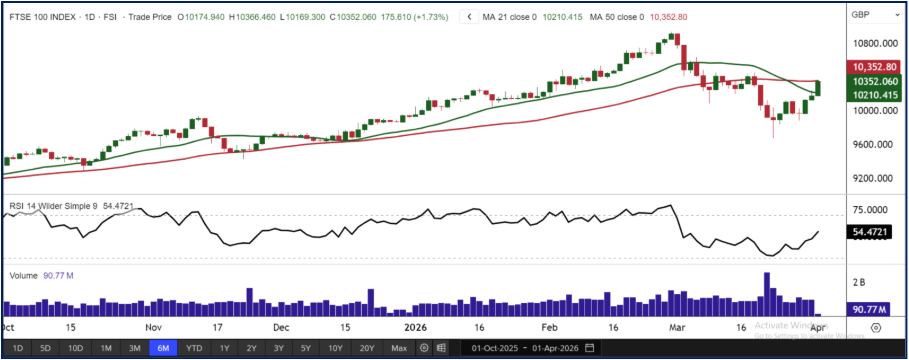
Source: Charts by EODHD/Others


 Please wait processing your request...