Section 1: Company Overview, Shariah Compliance Standards and Fundamentals
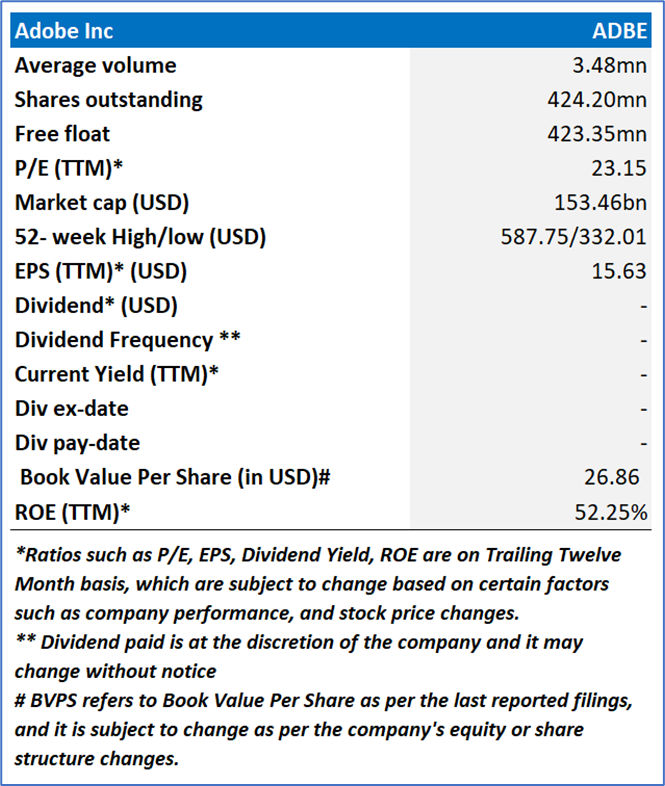
Section 1.1: Adobe Inc (NASDAQ: ADBE) is one of the leading American software companies founded in 1982 and headquartered in San Jose, California. The company is best known for Creative Cloud products like Photoshop, Illustrator, and Premiere Pro.
The Shariah Compliance Report covers the Investment Highlights, Shariah-compliance standards, Key Financial Metrics, Risks, and Technical Analysis along with the Valuation, Target Price, and Recommendation on the stock.
Section 1.2: What are the Key Metrics for Shariah Compliance to be Considered?
The Shariah Compliance Report aims to identify equities that align with Shariah and ethical principles, providing valuable insights on financial metrics, business activities and compliance with Islamic finance norms.
Key Shariah Screening Criteria and Thresholds

Shariah Metrics for Adobe (NASDAQ: ADBE)

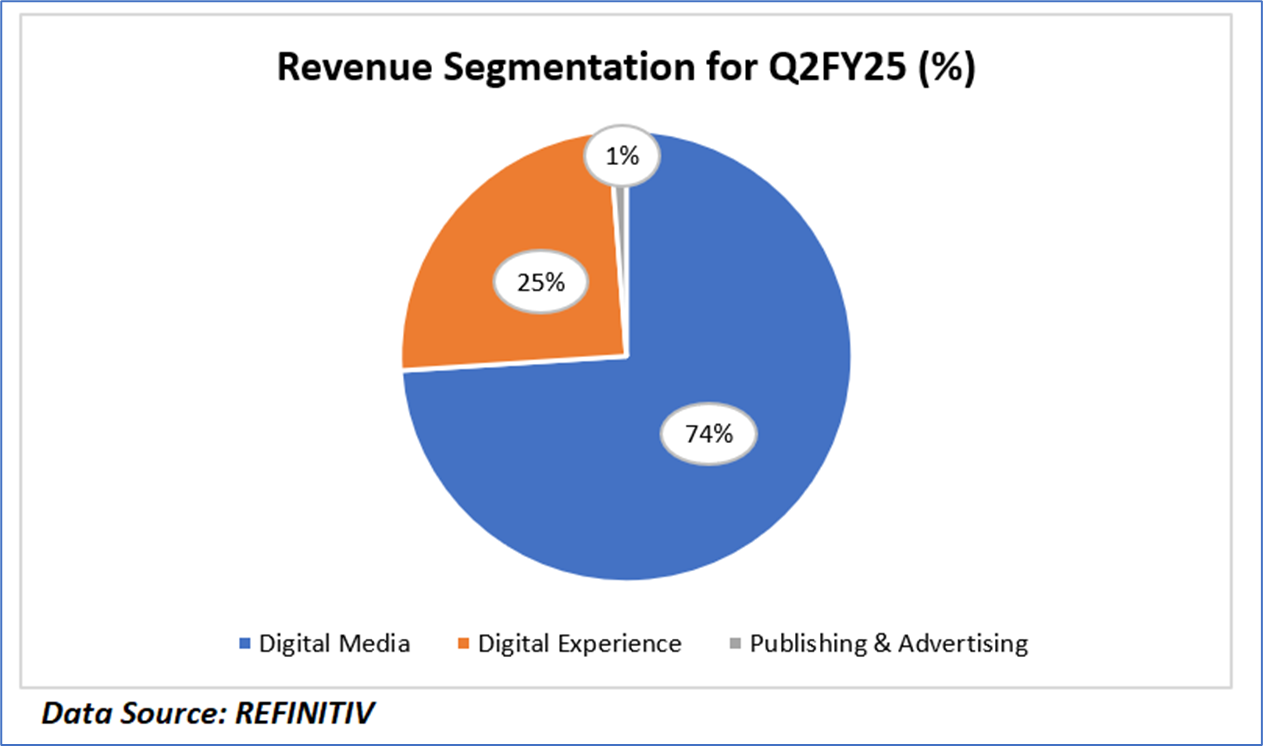
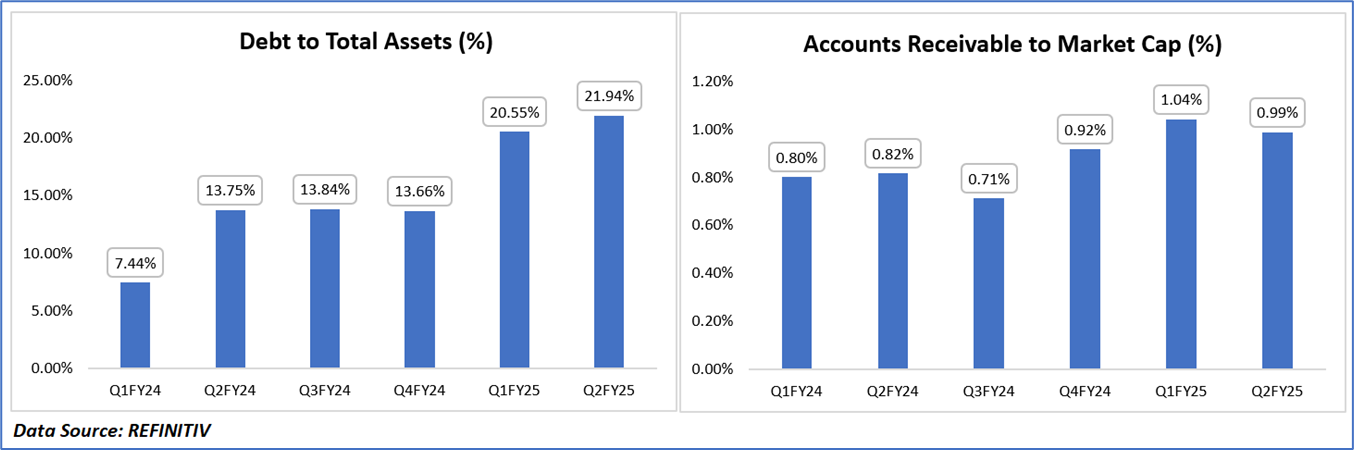
Revenue Segmentation of Adobe in Q2FY25 & Historical Compliance of Financial Ratios:
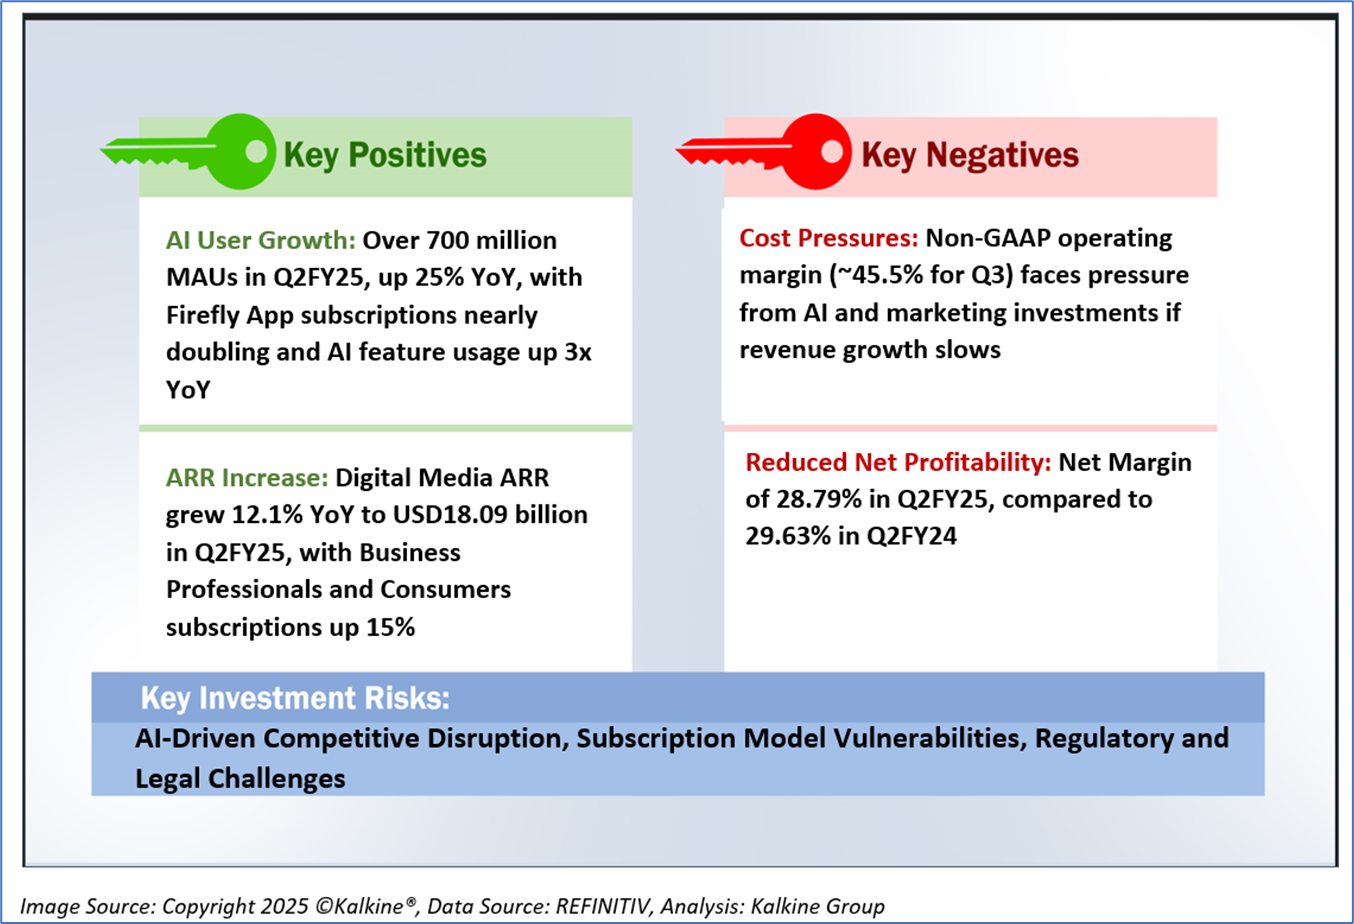
1.3 The Key Positives, Negatives, and Investment summary

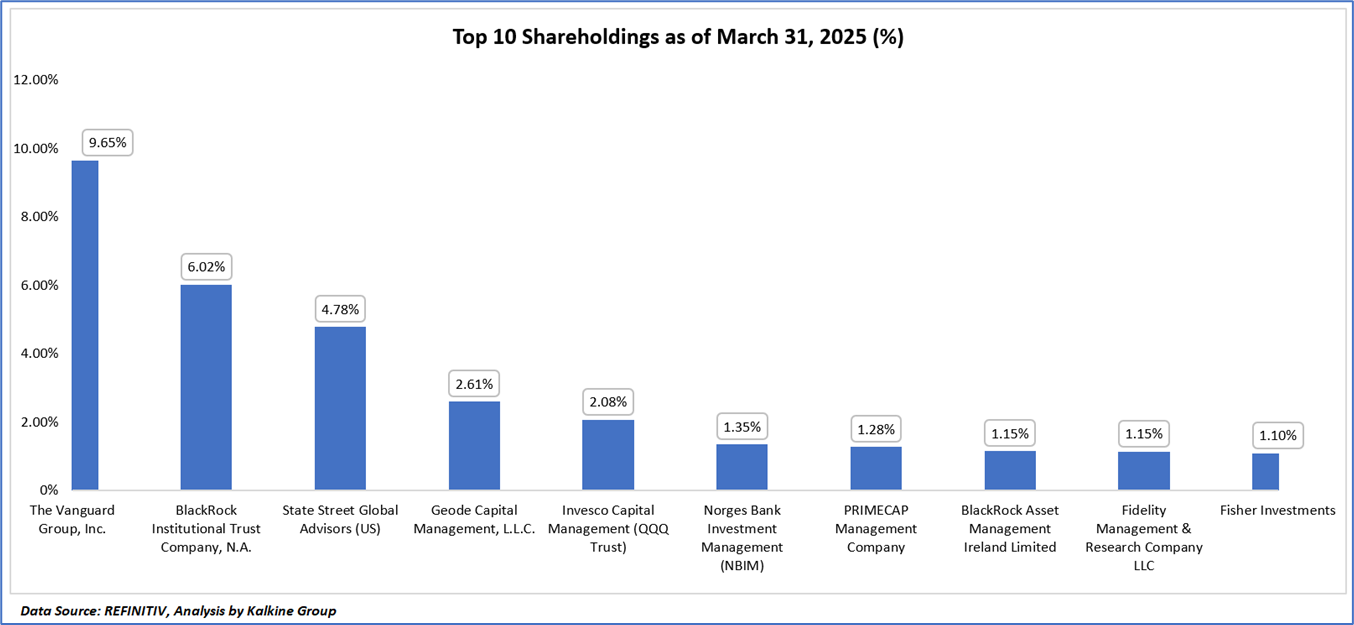
1.4 Top 10 shareholders:
The top 10 shareholders together form ~31.17% of the total shareholding, signifying concentrated shareholding. The Vanguard Group, Inc., and BlackRock Institutional Trust Company, N.A. are the biggest shareholders, holding the maximum stake in the company at ~9.65% and ~6.02%, respectively.
1.5 Key Metrics:
Adobe Inc. (Nasdaq: ADBE) demonstrated notable financial margin enhancements in Q2 FY25 compared to Q2 FY24, underscoring its operational efficiency and capital utilization strength. The gross profit margin improved slightly from 87.95% to 88.44%, reflecting robust revenue growth of USD5.87 billion (up 11% YoY) driven by AI-enhanced Digital Media and Digital Experience segments, with subscription revenue increases of 15% and 11%, respectively. The operating margin rose marginally from 35.51% to 35.91%, supported by a record GAAP operating income of USD2.11 billion, though the EBITDA margin remained nearly flat at 39.47% (down from 39.54%) due to increased AI and marketing investments. The income before tax margin dipped slightly from 36.35% to 35.77%, impacted by a higher income tax rate of 19.51% (up from 18.50%), resulting in a net margin decrease from 29.63% to 28.79%, despite a GAAP net income of USD1.69 billion (up 7.5% YoY). Significant improvements were seen in the trailing twelve-month (TTM) metrics, with free cash flow yield rising from 3.14% to 5.17%, driven by USD2.19 billion in operating cash flows, return on average common equity soaring from 34.22% to 52.25%, return on average total assets increasing from 17.56% to 23.64%, and return on invested capital climbing from 26.58% to 37.07%, reflecting Adobe’s superior capital efficiency and AI-driven growth.

Section 2: Business Updates and Financial Highlights
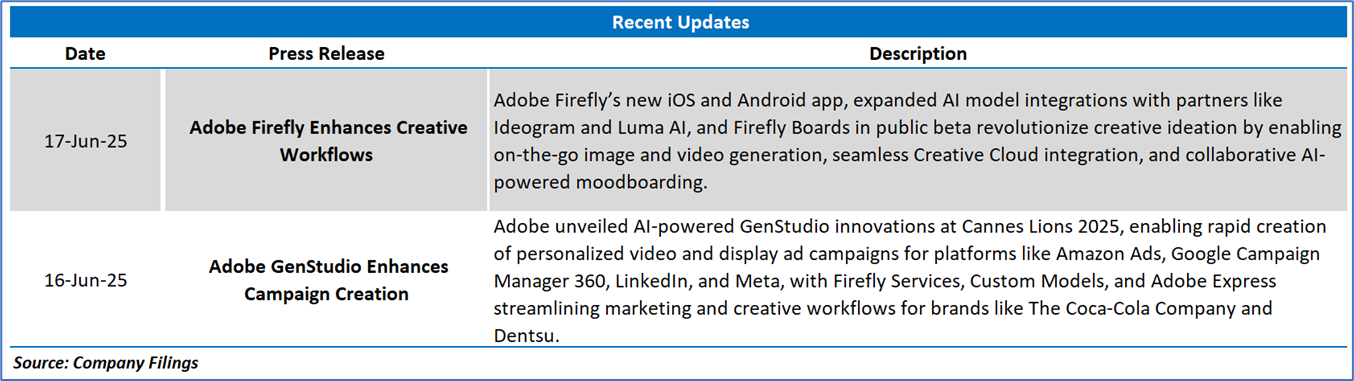
2.1 Recent Updates:
The below picture gives an overview of the recent updates:
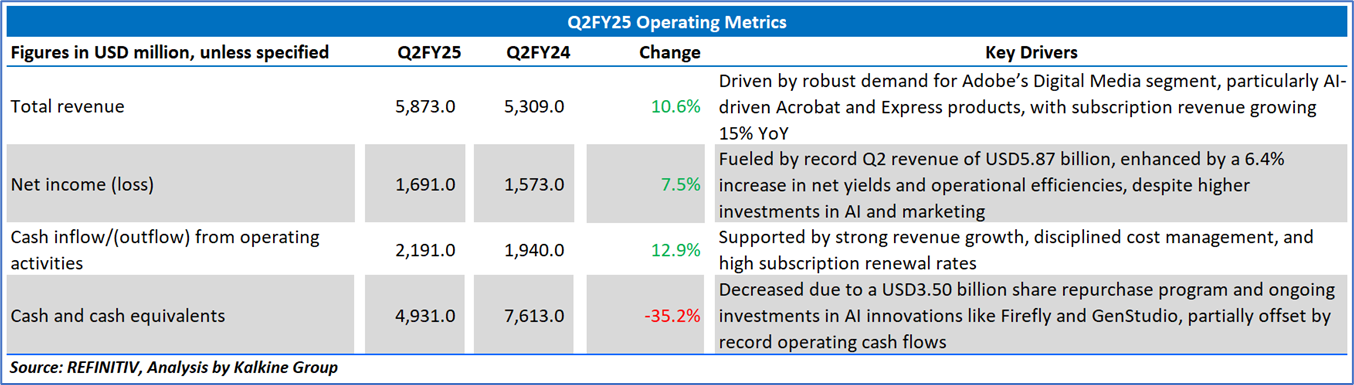
2.2 Insights of Q2FY25:
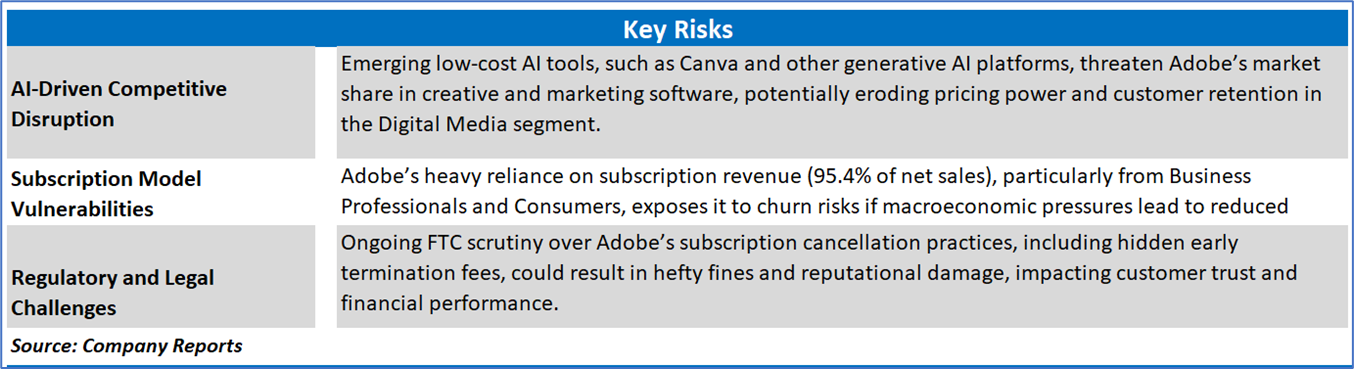
Section 3: Key Risks and Outlook:
Section 4: Stock Recommendation Summary:
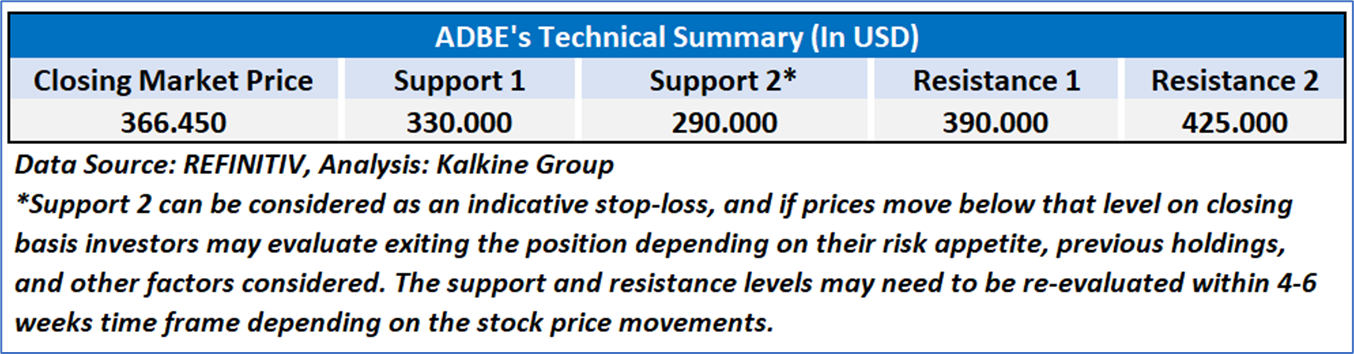
4.1 Technical Summary:
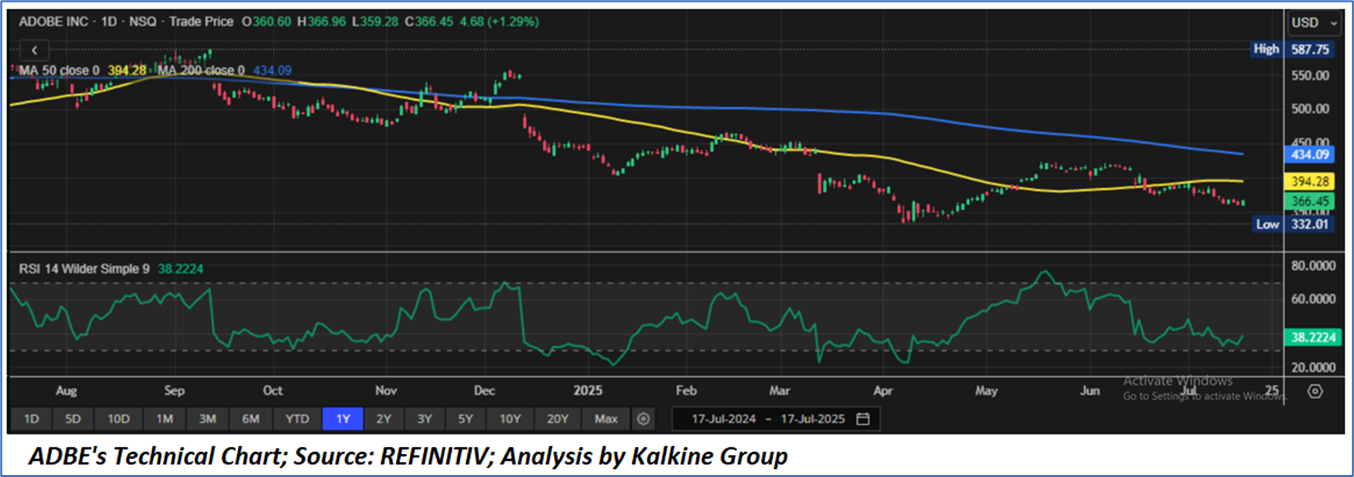
Price Performance:
- ADBE's share price has given a return of 5.06% in the past three months. On the other hand, in the long term, the stock has corrected by 14.16% over the past six months.
- The stock is leaning towards the lower band of its 52-week range of USD 587.75 and 52-week low price of USD 322.01, with the current price near an important support area of USD 320.00-USD 350.00, therefore an expectation of upward movement if the levels sustain.
- The price is currently below both its short-term (50-day) SMA and long-term (200-day) SMA, with the current RSI of 38.22, taking support near oversold levels, with expectations of upward movement if the above-mentioned support sustains.
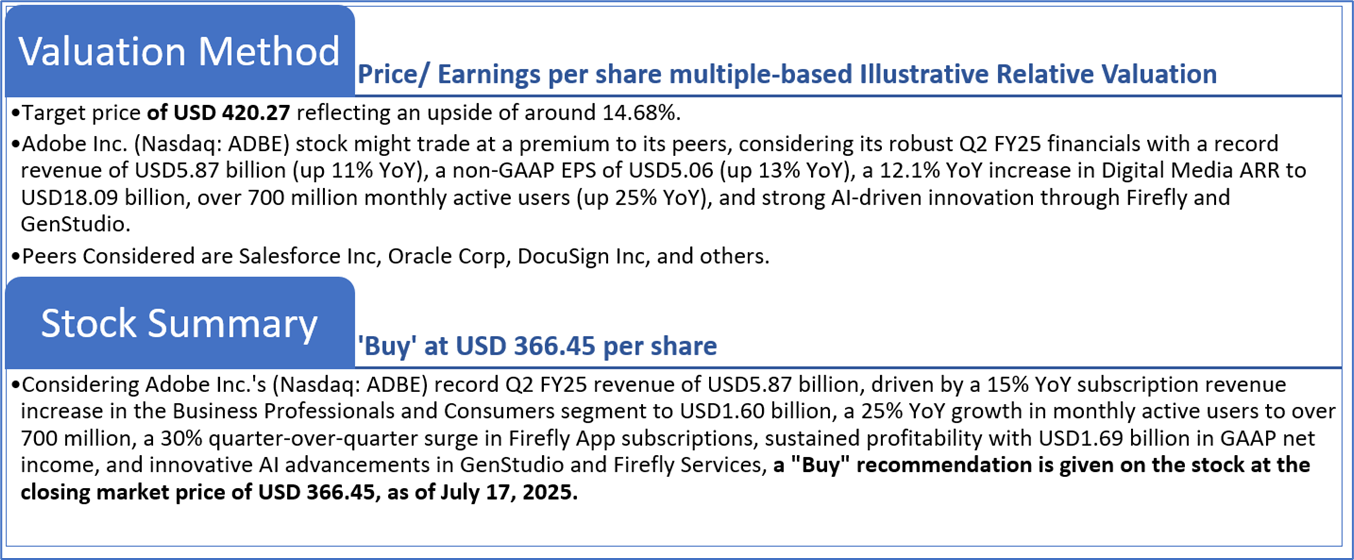
4.2 Fundamental Valuation
Valuation Methodology: Price/Earnings Per Share Multiple Based Relative Valuation

Markets are trading in a highly volatile zone currently due to certain macroeconomic issues and geopolitical tensions prevailing. Therefore, it is prudent to follow a cautious approach while investing.
Note 1: Past performance is not a reliable indicator of future performance.
Note 2: The reference date for all price data, currency, technical indicators, support, and resistance levels is July 17, 2025. The reference data in this report has been partly sourced from REFINITIV.
Note 3: Investment decisions should be made depending on an individual's appetite for upside potential, risks, holding duration, and any previous holdings. An 'Exit' from the stock can be considered if the Target Price mentioned as per the Valuation and or the technical levels provided has been achieved and is subject to the factors discussed above.
Note 4: The report publishing date is as per the Pacific Time Zone.
Technical Indicators Defined: -
Support: A level at which the stock prices tend to find support if they are falling, and a downtrend may take a pause backed by demand or buying interest. Support 1 refers to the nearby support level for the stock and if the price breaches the level, then Support 2 may act as the crucial support level for the stock.
Resistance: A level at which the stock prices tend to find resistance when they are rising, and an uptrend may take a pause due to profit booking or selling interest. Resistance 1 refers to the nearby resistance level for the stock and if the price surpasses the level, then Resistance 2 may act as the crucial resistance level for the stock.
Stop-loss: It is a level to protect against further losses in case of unfavorable movement in the stock prices.
Disclaimer-
This report has been issued by Kalkine Limited (Company number 07903332), a private limited company, incorporated in England and Wales ("Kalkine”). Kalkine.co.uk and associated pages are published by Kalkine. Kalkine is authorised and regulated by the Financial Conduct Authority under reference number 579414.
The information in this report and on the Kalkine website has been prepared from a wide variety of sources, which Kalkine, to the best of its knowledge and belief, considers accurate. Kalkine has made every effort to ensure the reliability of information contained in its reports, newsletters and websites. All information represents our views at the date of publication and may change without notice. The information in this report does not constitute an offer to sell securities or other financial products or a solicitation of an offer to buy securities or other financial products. Our reports contain non personalized recommendations to invest in securities and other financial products.
Kalkine does not offer financial advice based upon your personal financial situation or goals, and we shall not be held liable for any investment or trading losses you may incur by using the opinions expressed in our reports, publications, market updates, news alerts and corporate profiles. Kalkine does not intend to exclude any liability which it is not permitted to exclude under applicable law or regulation. Kalkine’s non-personalised advice does not in any way endorse or recommend individuals, investment products or services for your personal financial situation. You should discuss your portfolios and the risk tolerance level appropriate for your personal financial situation, with a professional authorised financial planner and adviser. You should be aware that the value of any investment and the income from it can go down as well as up and you may not get back the amount invested.
Please also read our Terms & Conditions for further information. Employees and/or associates of Kalkine and its related entities may hold interests in the securities or other financial products covered in this report or on the Kalkine website. Any such employees and associates are required to comply with certain safeguards, procedures and disclosures as required by law.
Kalkine Media Limited, an affiliate of Kalkine, may have received, or be entitled to receive, financial consideration in connection with providing information about certain entity(s) covered on its website including entities covered in this report.
Past performance is not a reliable indicator of future performance.

 Please wait processing your request...