Section 1: Company Overview, Shariah Compliance Standards and Fundamentals
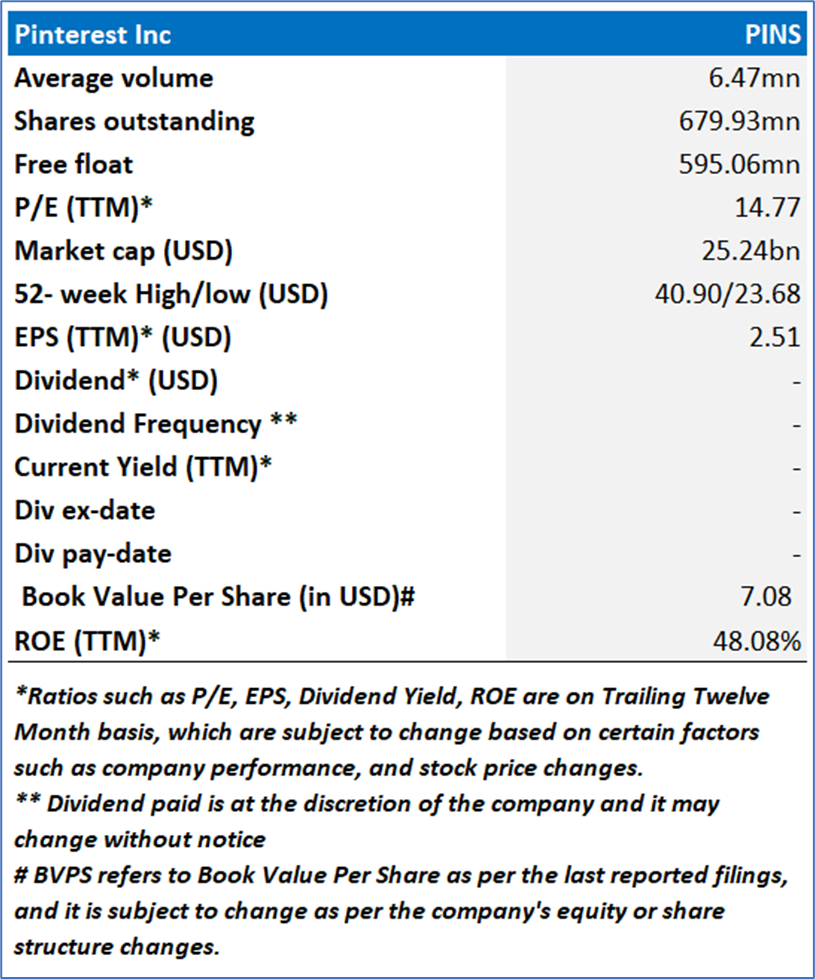
Section 1.1: Pinterest, Inc. (Pinterest) (NYSE: PINS) offers visual search and discovery platform. The Company’s primary service, Pinterest, can be accessed through its mobile application or the Web. People use Pinterest to find ideas. As they browse Pinterest content, Pins, they fine-tune their tastes and find the idea.
Kalkine’s ‘The Shariah Compliance Report’ covers the Investment Highlights, Shariah-compliance standards, Key Financial Metrics, Risks, and Technical Analysis along with the Valuation, Target Price, and Recommendation on the stock.
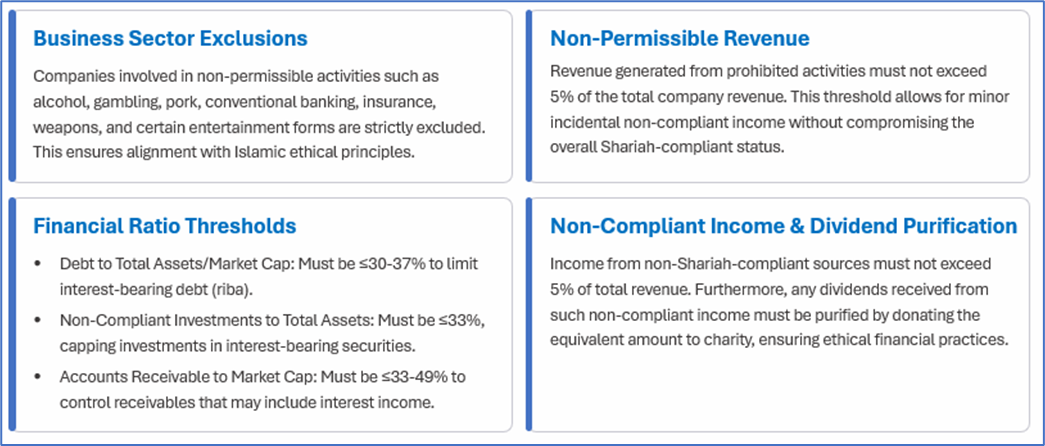
Section 1.2: What are the Key Metrics for Shariah Compliance to be Considered?
The Shariah Compliance Report aims to identify equities that align with Shariah and ethical principles, providing valuable insights on financial metrics, business activities and compliance with Islamic finance norms.
Key Shariah Screening Criteria and Thresholds
Shariah Metrics for Pinterest, Inc. (NYSE: PINS):
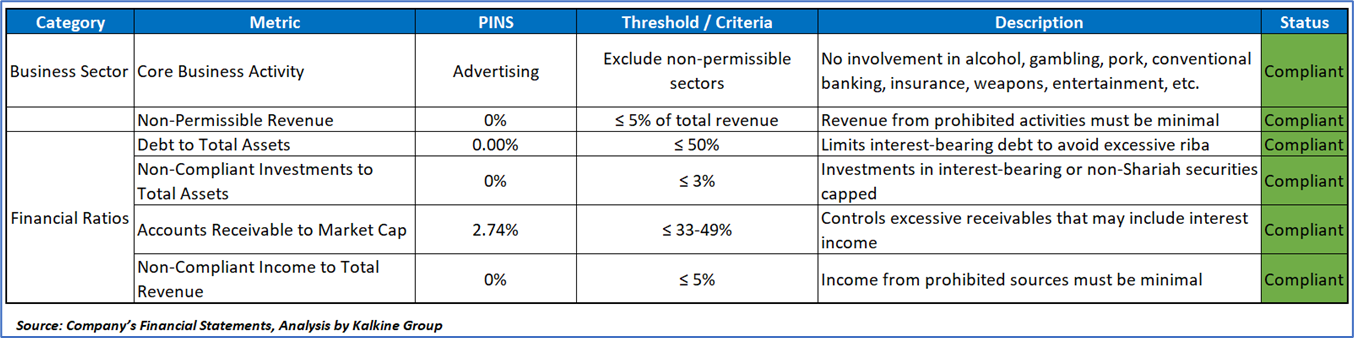
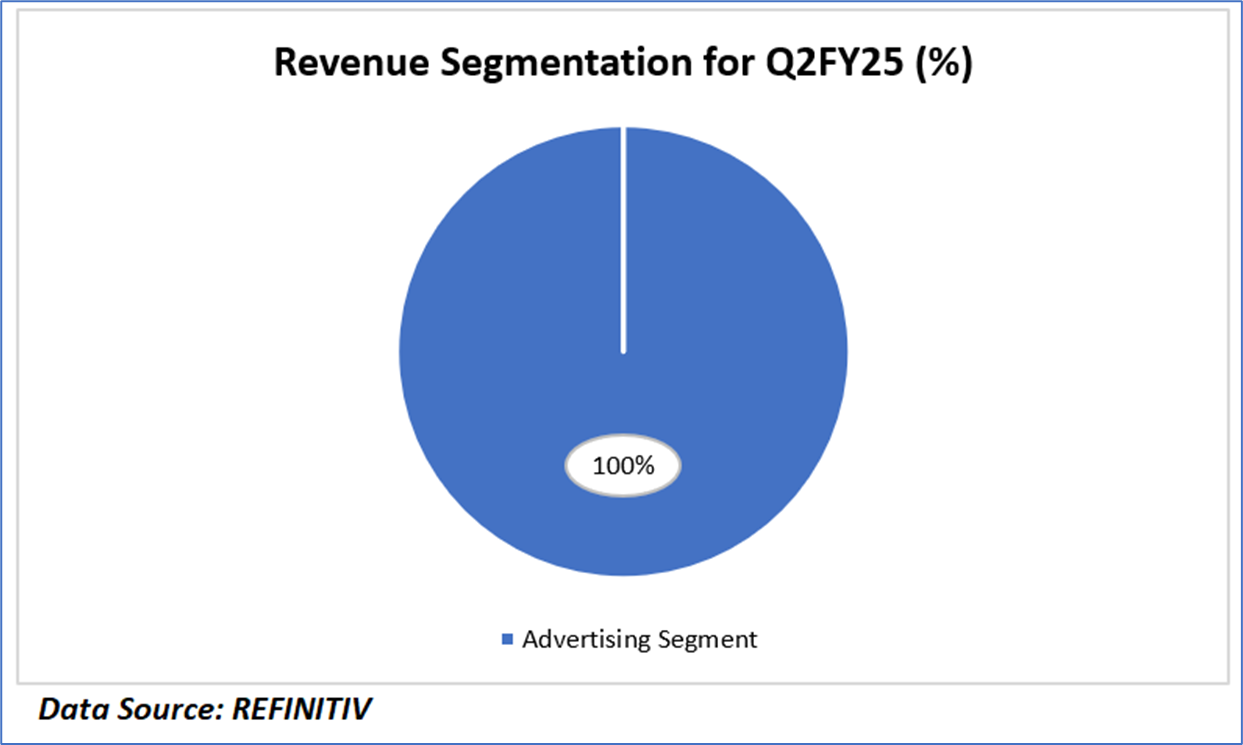
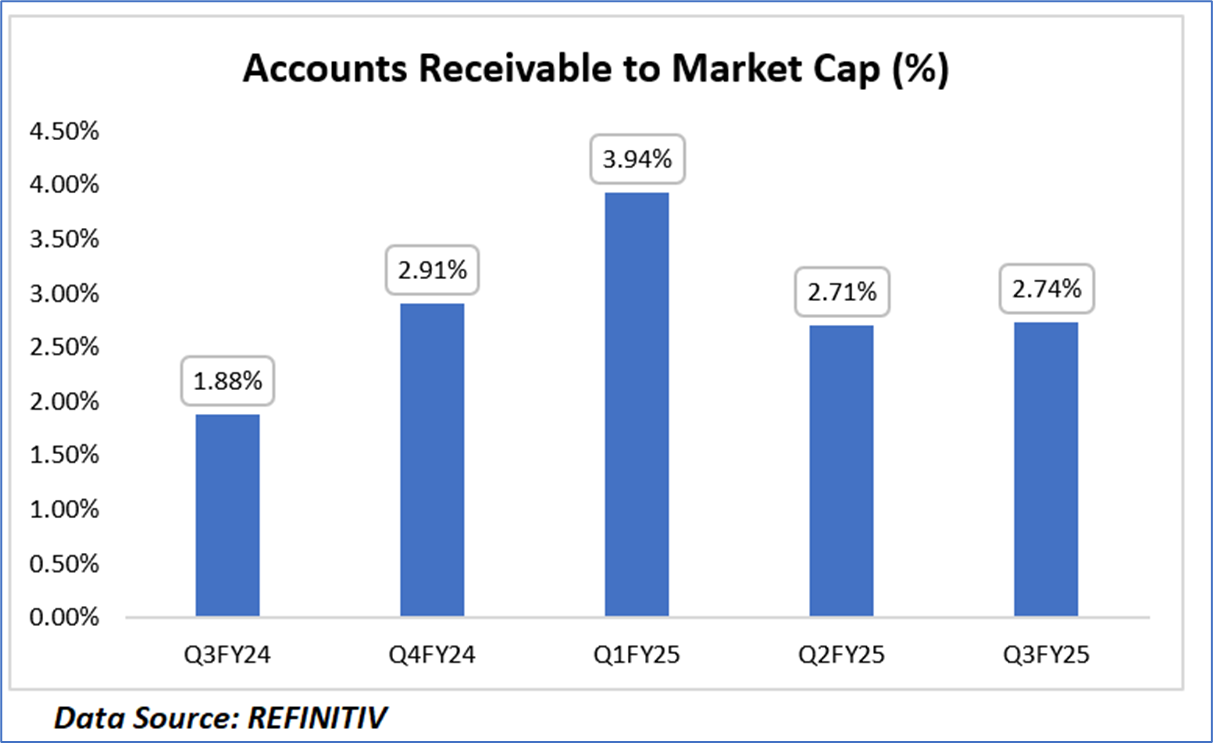
Revenue Segmentation of PINS in Q2FY25 & Historical Compliance of Financial Ratios:
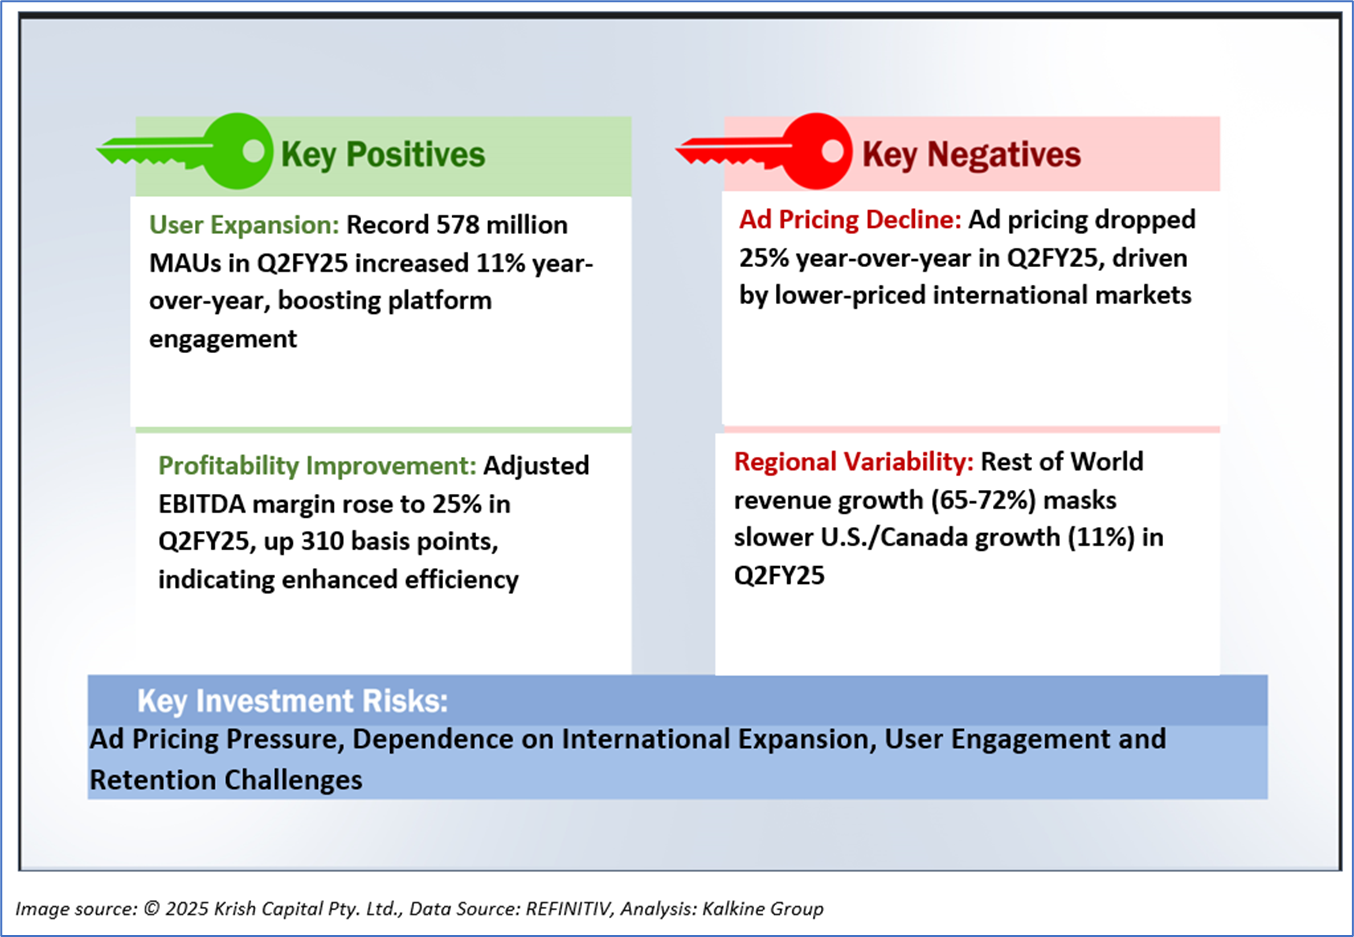
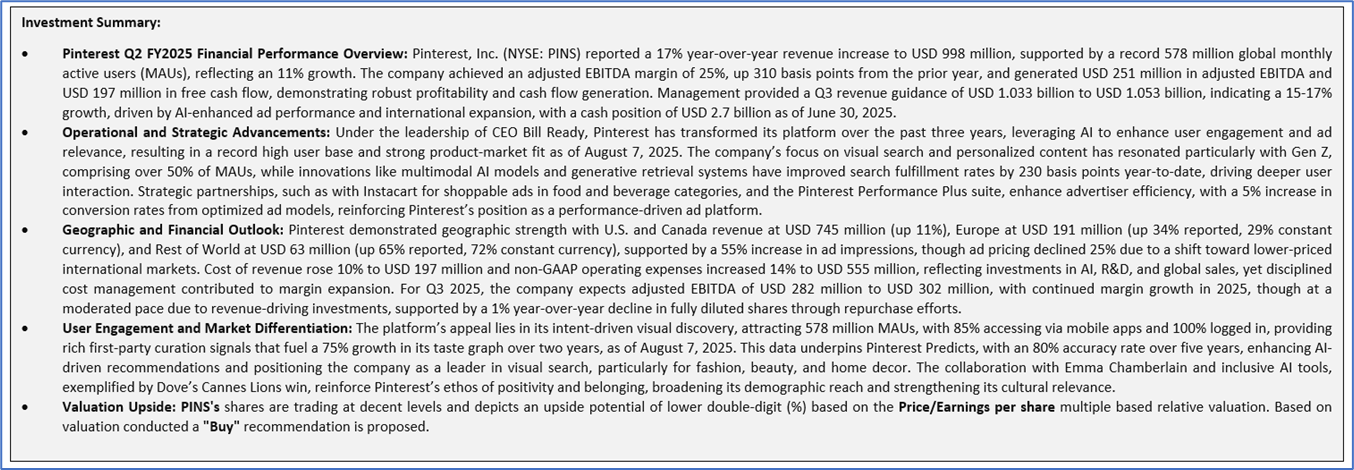
1.3 The Key Positives, Negatives, and Investment summary
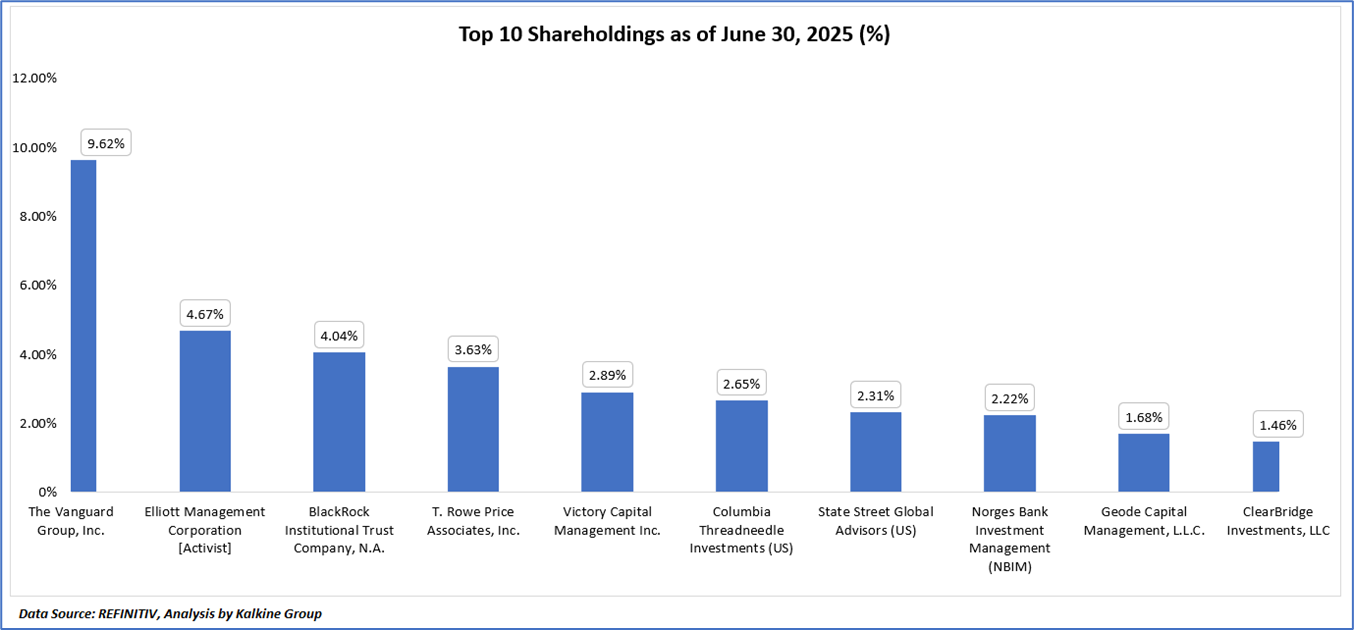
1.4 Top 10 shareholders:
The top 10 shareholders together form ~35.19% of the total shareholding, signifying concentrated shareholding. The Vanguard Group, Inc., and Elliott Management Corporation [Activist] are the biggest shareholders, holding the maximum stake in the company at ~9.62% and ~4.67%, respectively.
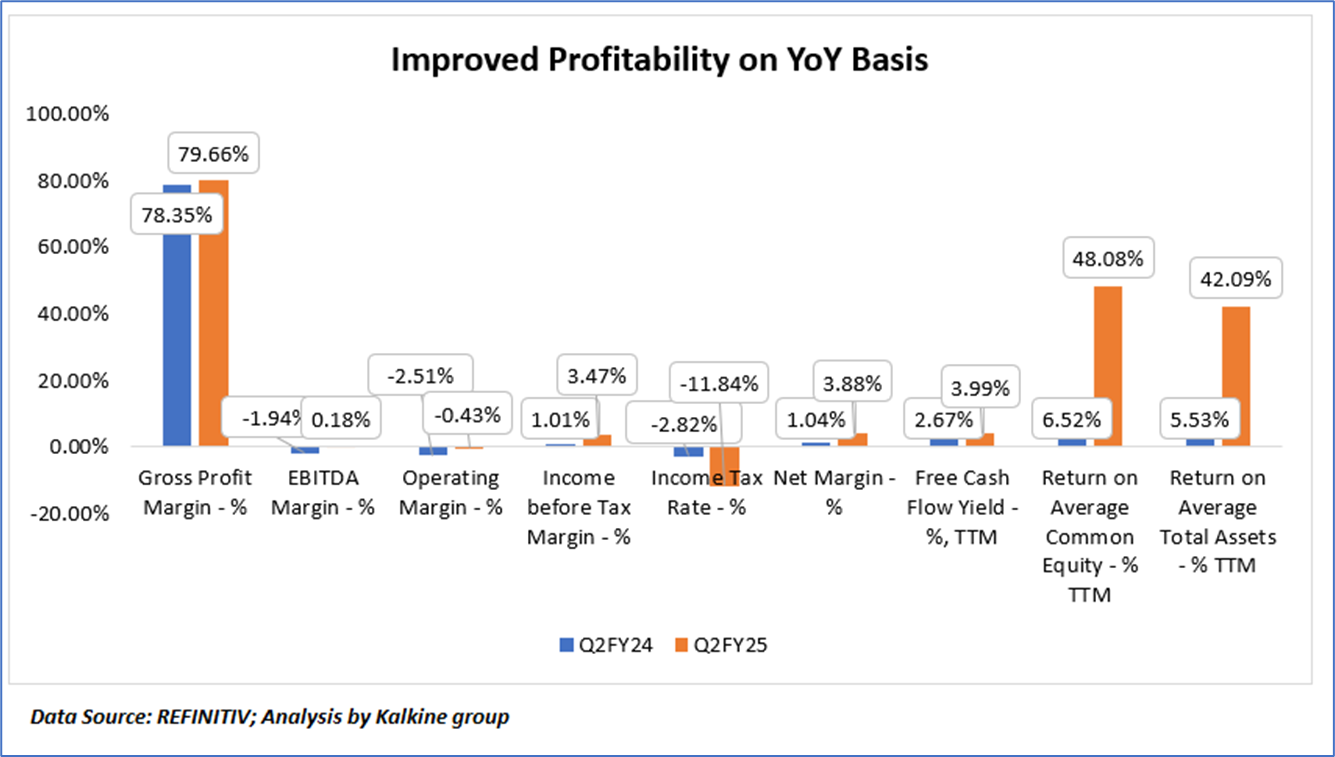
1.5 Key Metrics:
Pinterest, Inc. (NYSE: PINS) demonstrated a notable improvement in its financial metrics for the second quarter of fiscal 2025 compared to the same period in 2024, with gross profit margin rising from 78.35% to 79.66%, reflecting enhanced operational efficiency and pricing power amid a 17% revenue increase to USD 998 million as of September 05, 2025. The EBITDA margin turned positive to 0.18% from -1.94%, and the operating margin improved from -2.51% to -0.43%, indicating a shift toward profitability driven by cost discipline and AI-driven ad performance, though income before tax margin surged from 1.01% to 3.47% and net margin rose from 1.04% to 3.88%, bolstered by a favorable income tax rate shift to -11.84% from -2.82%, likely due to tax benefits or adjustments. Additionally, the trailing twelve-month (TTM) free cash flow yield increased from 2.67% to 3.99%, and return metrics saw dramatic growth with return on average common equity climbing from 6.52% to 48.08% and return on average total assets rising from 5.53% to 42.09%, suggesting robust capital efficiency and a strong foundation for future growth, though sustained profitability will depend on managing ad pricing pressures and international market dynamics.
Section 2: Business Updates and Financial Highlights
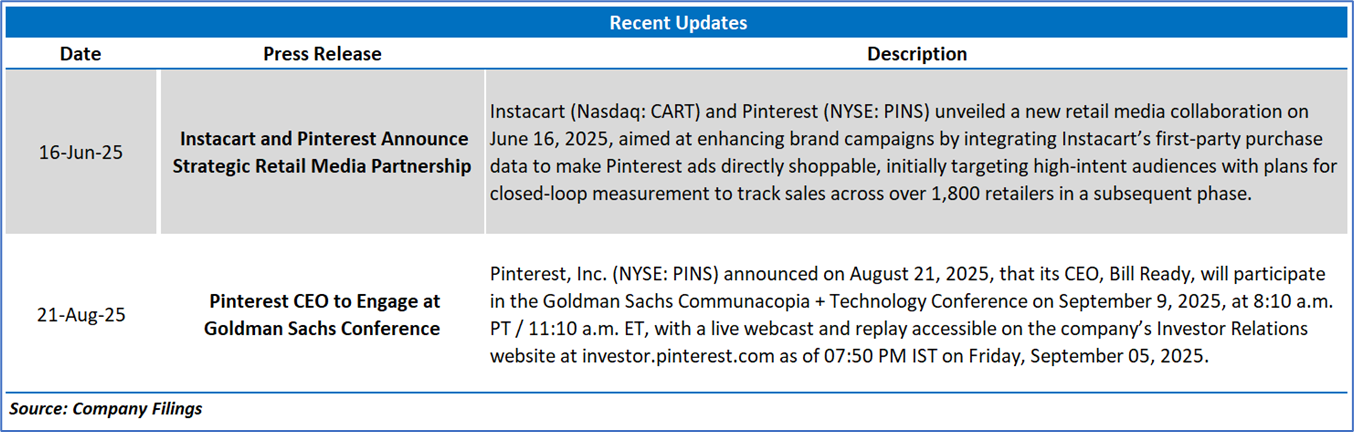
2.1 Recent Updates:
The below picture gives an overview of the recent updates:
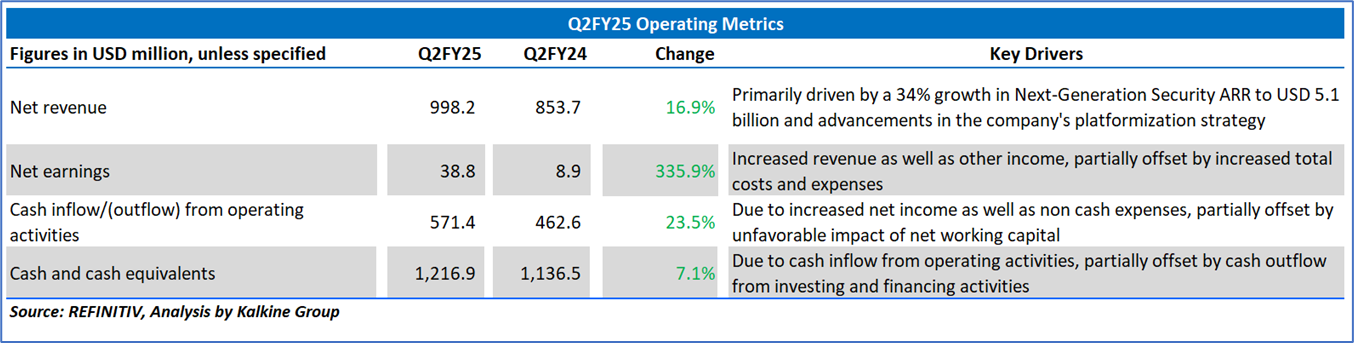
2.2 Insights of Q2FY25:
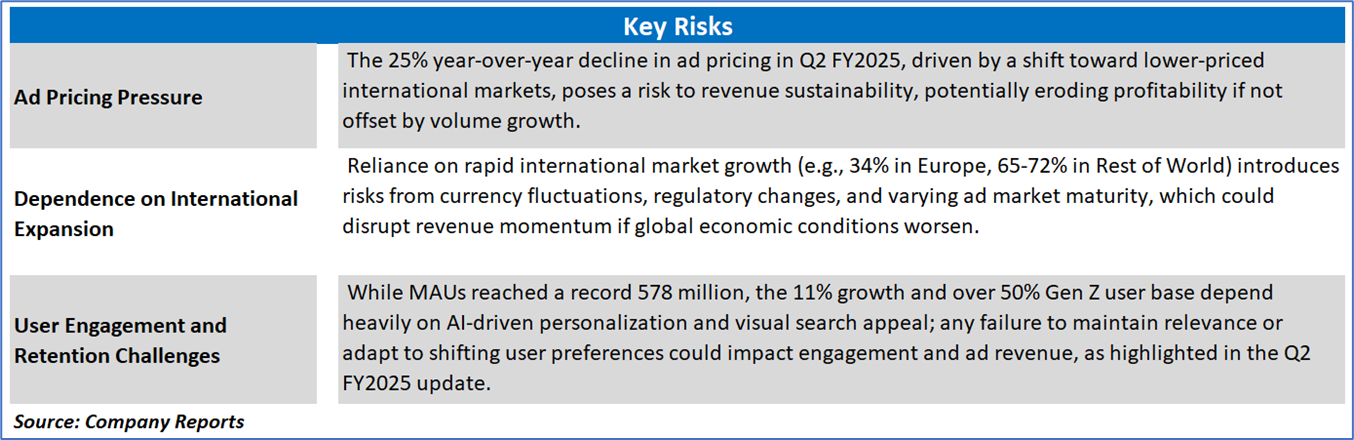
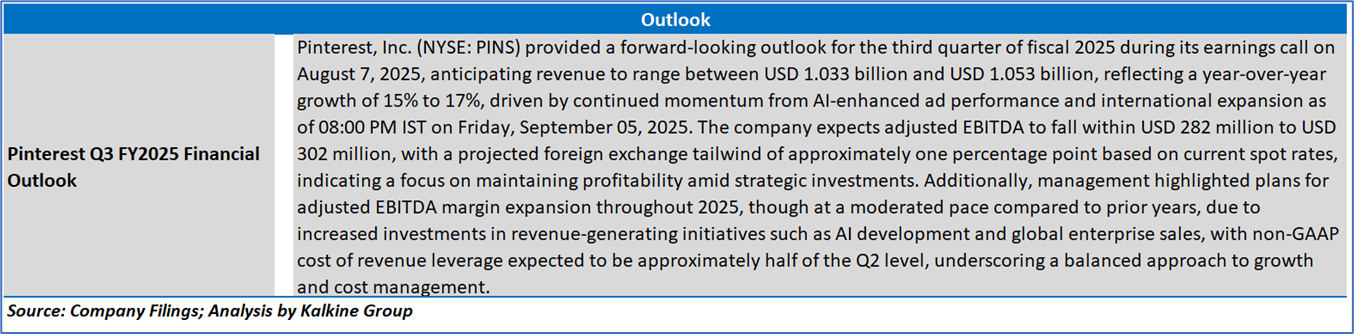
Section 3: Key Risks and Outlook:
Section 4: Stock Recommendation Summary:
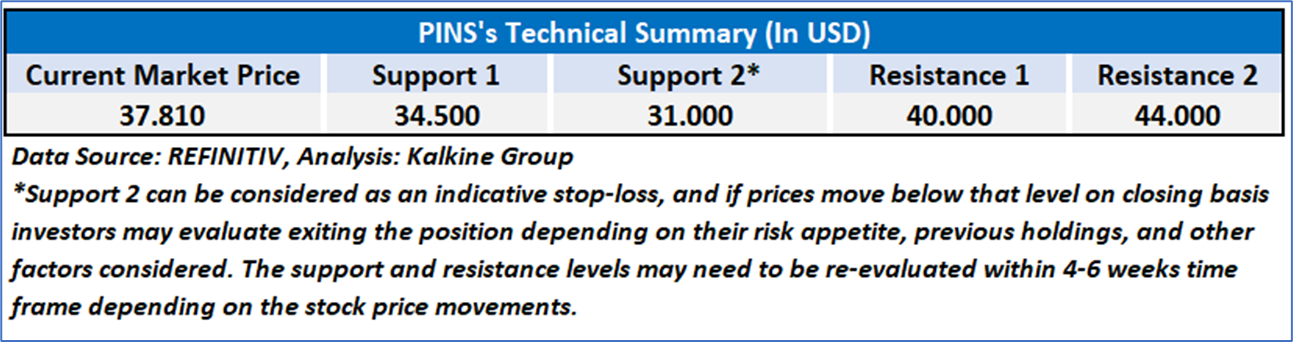
4.1 Technical Summary:
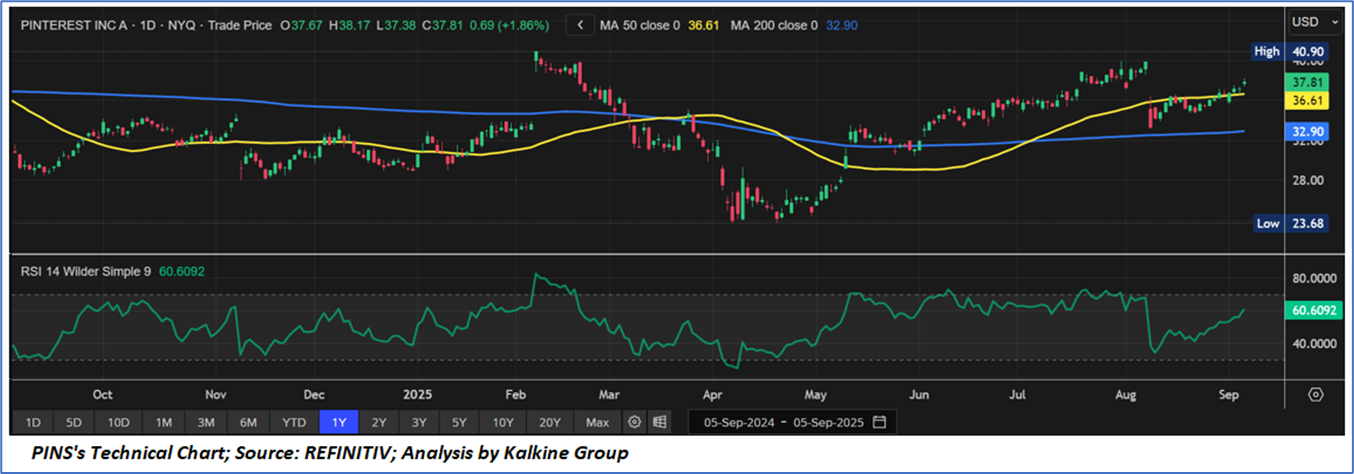
Price Performance:
- PINS's share price has given a return of approx. 10.69% in the past three months. Similarly, in the long term, stocks returned 10.47% over the past six months.
- The stock is leaning towards the upper band of its 52-week range of USD 40.90 and 52-week low price of USD 23.68, with the current price near an important resistance of USD 38.00-USD 40.00, therefore an expectation of upward movement if the levels break on the upside.
- The price is currently above both its short-term (50-day) SMA and long-term (200-day) SMA, with the current RSI of 60.61, upward trending, with expectations of upward continuation if the above-mentioned resistance breaks.
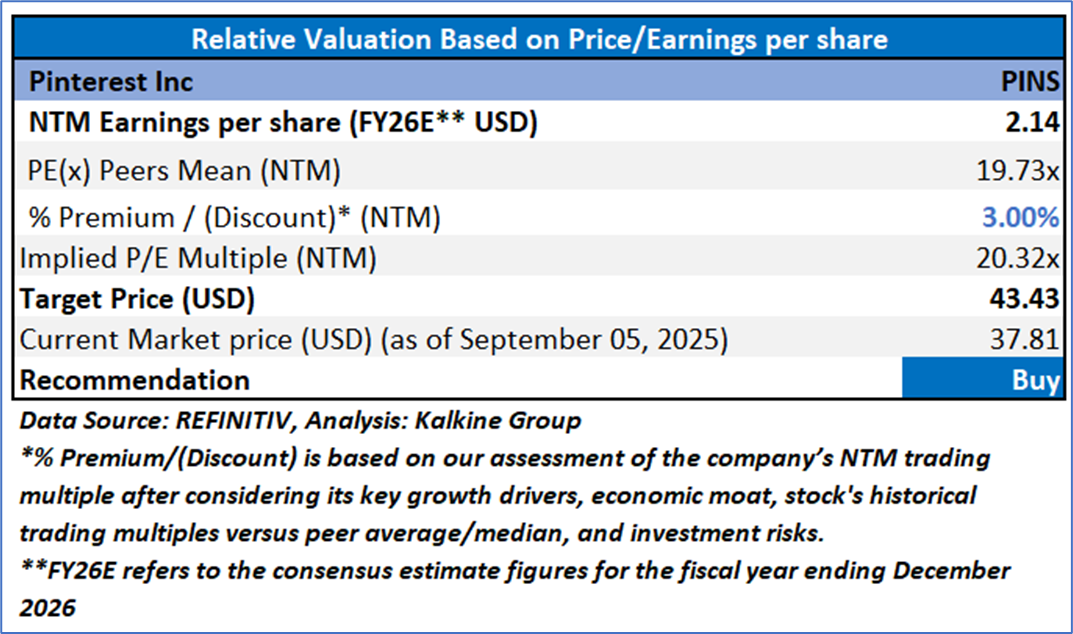
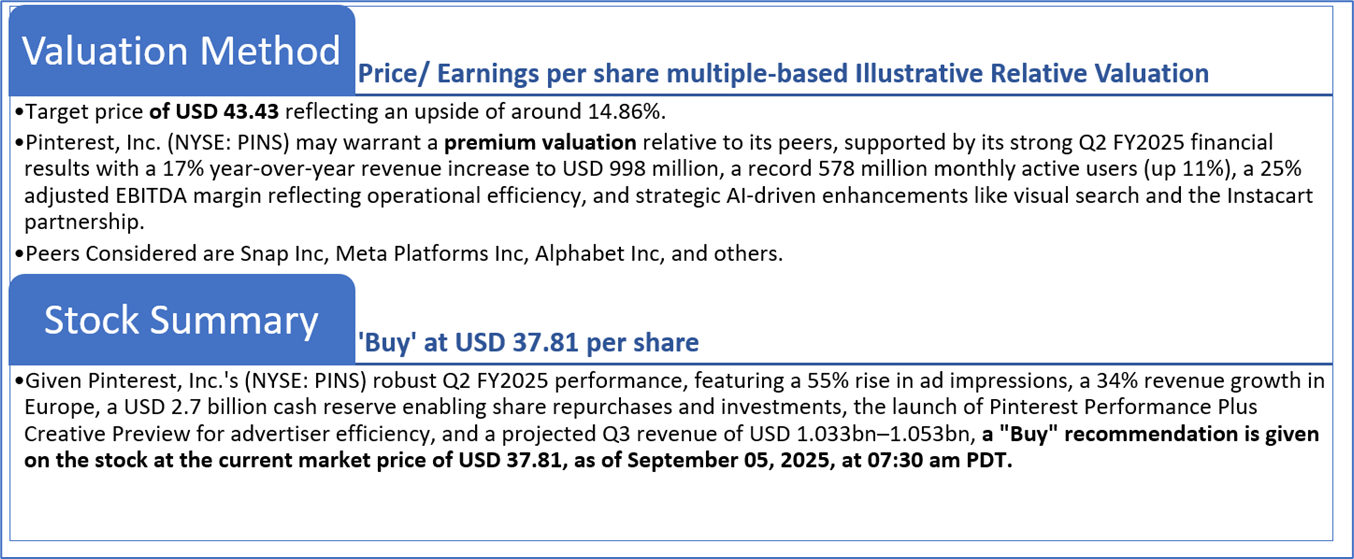
4.2 Fundamental Valuation
Valuation Methodology: Price/Earnings Per Share Multiple Based Relative Valuation
Markets are trading in a highly volatile zone currently due to certain macroeconomic issues and geopolitical tensions prevailing. Therefore, it is prudent to follow a cautious approach while investing.
Note 1: Past performance is not a reliable indicator of future performance.
Note 2: The reference date for all price data, currency, technical indicators, support, and resistance levels is September 05, 2025. The reference data in this report has been partly sourced from REFINITIV.
Note 3: Investment decisions should be made depending on an individual's appetite for upside potential, risks, holding duration, and any previous holdings. An 'Exit' from the stock can be considered if the Target Price mentioned as per the Valuation and or the technical levels provided have been achieved and is subject to the factors discussed above.
Note 4: The report publishing date is as per the Pacific Time Zone.
Technical Indicators Defined: -
Support: A level at which the stock prices tend to find support if they are falling, and a downtrend may take a pause backed by demand or buying interest. Support 1 refers to the nearby support level for the stock and if the price breaches the level, then Support 2 may act as the crucial support level for the stock.
Resistance: A level at which the stock prices tend to find resistance when they are rising, and an uptrend may take a pause due to profit booking or selling interest. Resistance 1 refers to the nearby resistance level for the stock and if the price surpasses the level, then Resistance 2 may act as the crucial resistance level for the stock.
Stop-loss: It is a level to protect against further losses in case of unfavorable movement in the stock prices.
Disclaimer-
This report has been issued by Kalkine Limited (Company number 07903332), a private limited company, incorporated in England and Wales ("Kalkine”). Kalkine.co.uk and associated pages are published by Kalkine. Kalkine is authorised and regulated by the Financial Conduct Authority under reference number 579414.
The information in this report and on the Kalkine website has been prepared from a wide variety of sources, which Kalkine, to the best of its knowledge and belief, considers accurate. Kalkine has made every effort to ensure the reliability of information contained in its reports, newsletters and websites. All information represents our views at the date of publication and may change without notice. The information in this report does not constitute an offer to sell securities or other financial products or a solicitation of an offer to buy securities or other financial products. Our reports contain non personalized recommendations to invest in securities and other financial products.
Kalkine does not offer financial advice based upon your personal financial situation or goals, and we shall not be held liable for any investment or trading losses you may incur by using the opinions expressed in our reports, publications, market updates, news alerts and corporate profiles. Kalkine does not intend to exclude any liability which it is not permitted to exclude under applicable law or regulation. Kalkine’s non-personalised advice does not in any way endorse or recommend individuals, investment products or services for your personal financial situation. You should discuss your portfolios and the risk tolerance level appropriate for your personal financial situation, with a professional authorised financial planner and adviser. You should be aware that the value of any investment and the income from it can go down as well as up and you may not get back the amount invested.
Please also read our Terms & Conditions for further information. Employees and/or associates of Kalkine and its related entities may hold interests in the securities or other financial products covered in this report or on the Kalkine website. Any such employees and associates are required to comply with certain safeguards, procedures and disclosures as required by law.
Kalkine Media Limited, an affiliate of Kalkine, may have received, or be entitled to receive, financial consideration in connection with providing information about certain entity(s) covered on its website including entities covered in this report.
Past performance is not a reliable indicator of future performance.

 Please wait processing your request...