0R15 7953.0 -2.8463% 0R1E None None% 0M69 None None% 0R2V 216.5 -3.9911% 0QYR None None% 0QYP 374.0 -4.1026% 0RUK None None% 0RYA 1666.0 -3.588% 0RIH 166.8 0.0% 0RIH 163.7 -1.8585% 0R1O 196.75 10041.7526% 0R1O None None% 0QFP 5040.0 0.0% 0M2Z 260.5986 -0.9696% 0VSO 40.5 13.7481% 0R1I None None% 0QZI 641.0 0.0% 0QZ0 220.0 0.0% 0NZF None None% 0YXG 189.72 0.0543%

One NYSE-Listed Oil & Gas Refining Stock to Consider: Par Pacific Holdings Inc
Section 1: Company Overview and Fundamentals
Company Overview:
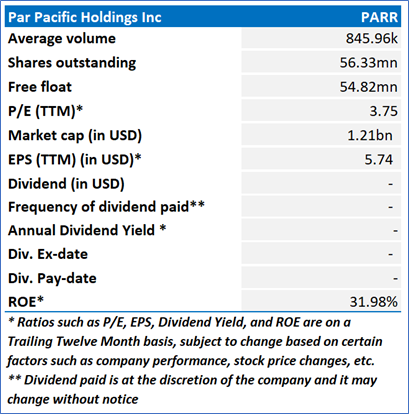
Par Pacific Holdings, Inc. (NYSE: PARR) is an energy company, which provides both renewable and conventional fuels to the western United States. It owns and operates 125,000 barrels per day of combined refining capacity across three locations and an energy infrastructure network, including 7.6 million barrels of storage, and marine, rail, rack and pipeline assets. The Company has three segments. Refining segment owns and operates four refineries with total operating crude oil throughput capacity of 219 thousand barrels per day (Mbpd)
Kalkine’s US Diversified Opportunities Report covers the Company Overview, Key positives & negatives, Investment summary, Key investment metrics, Top 10 shareholding, Business updates and insights into company recent financial results, Key Risks & Outlook, Price performance and technical summary, Target Price, and Recommendation on the stock.
Stock Performance:
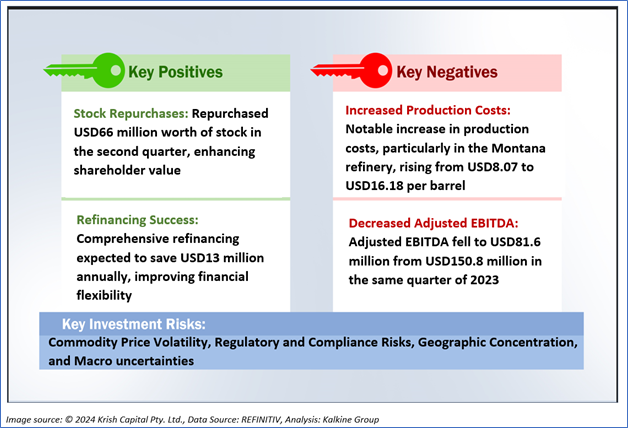
1.2 The Key Positives, Negatives, and Investment summary

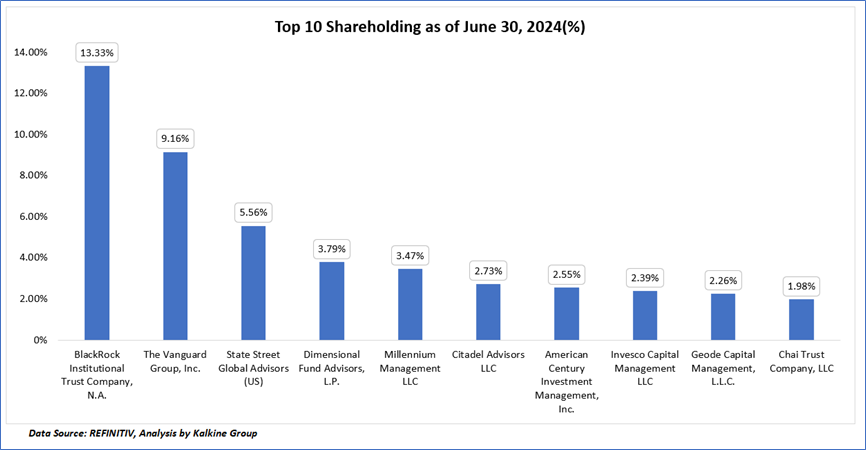
1.3 Top 10 shareholders:
The top 10 shareholders together form ~47.22% of the total shareholding, signifying concentrated shareholding. BlackRock Institutional Trust Company, N.A., and The Vanguard Group, Inc. are the biggest shareholders, holding the maximum stake in the company at ~13.33% and ~9.16%, respectively.
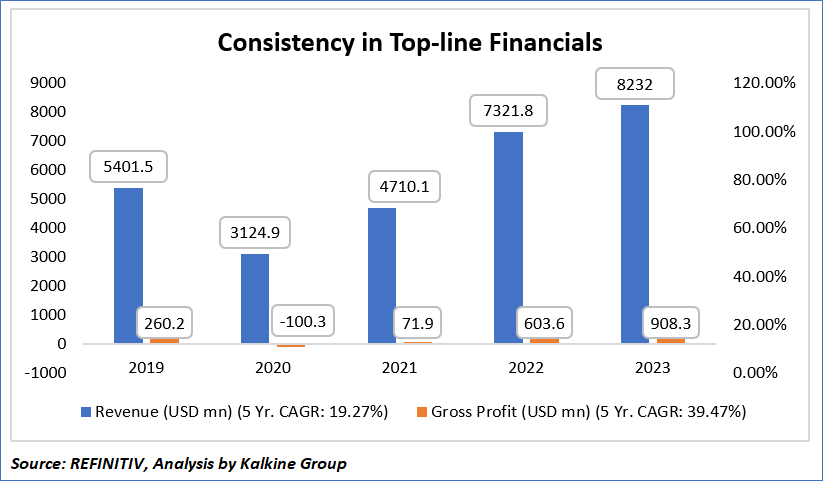
1.4 Key Metrics:
Par Pacific Holdings, Inc. has demonstrated growth in recent years. Over the past five years, the company's revenue has experienced a robust compound annual growth rate (CAGR) of 19.27%, rising from USD 5,401.5 million in 2019 to USD 8,232 million in 2023. Concurrently, the gross profit saw an impressive recovery and expansion, with a five-year CAGR of 39.47%, escalating from USD 260.2 million in 2019 to USD 908.3 million in 2023. This progression underscores Par Pacific's strengthening financial performance, overcoming challenges such as a negative gross profit in 2020.
Section 2: Business Updates and Corporate Business Highlights
2.1 Recent Updates:
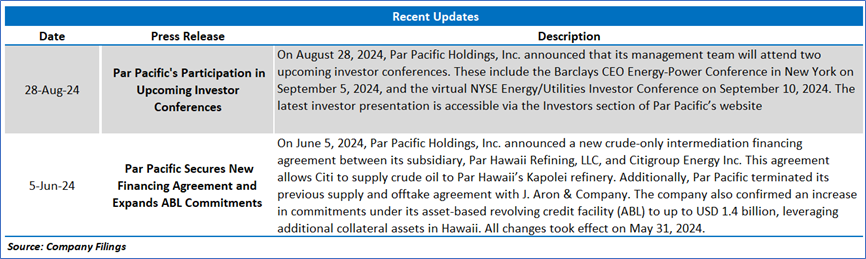
The below picture gives an overview of the recent updates:
2.2 Insights of Q2FY24:

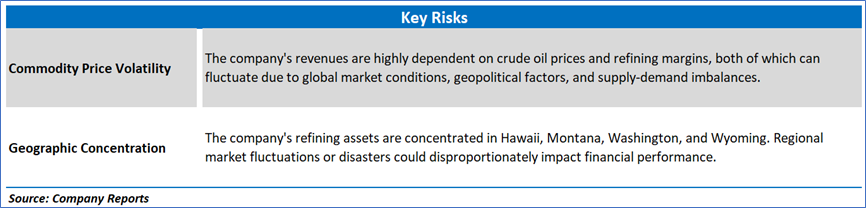
Section 3: Key Risks & Outlook:
Section 4: Stock Recommendation Summary:
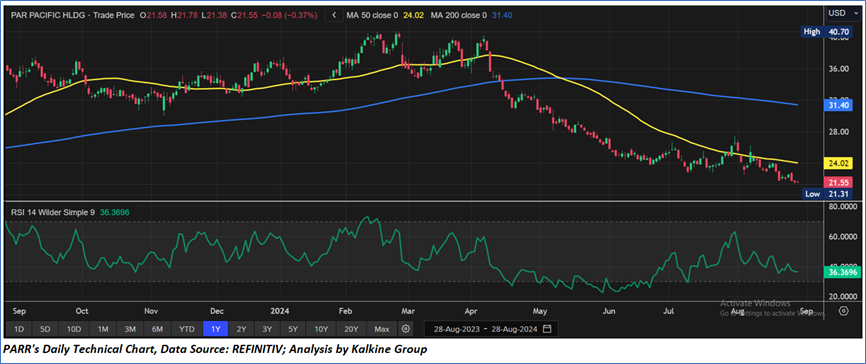
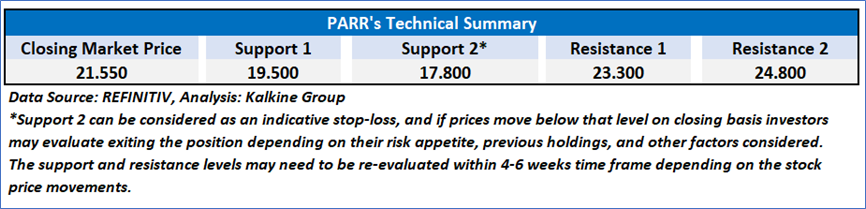
4.1 Price Performance and Technical Summary:
Stock Performance:
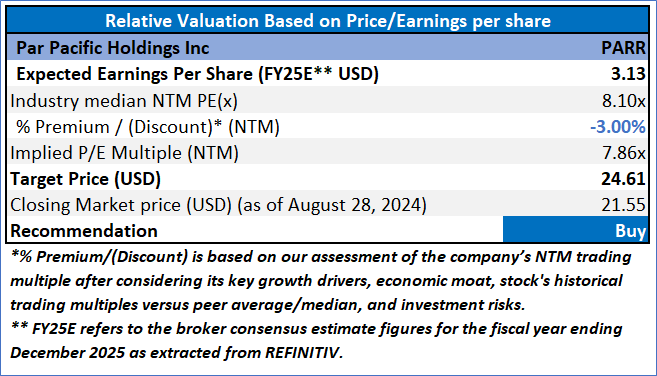
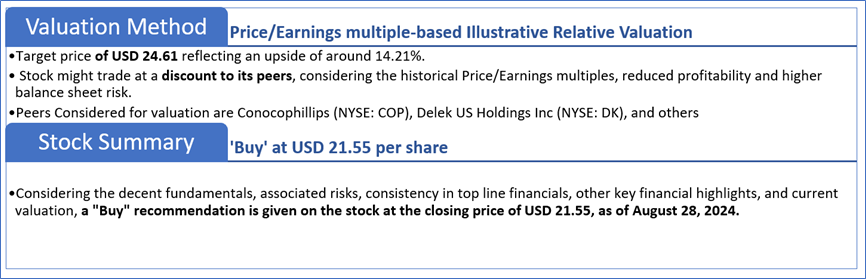
4.2 Fundamental Valuation
Valuation Methodology: Price/Earnings Multiple Based Relative Valuation
Markets are trading in a highly volatile zone currently due to certain macroeconomic issues and geopolitical tensions prevailing. Therefore, it is prudent to follow a cautious approach while investing.
Note 1: Past performance is not a reliable indicator of future performance.
Note 2: The reference date for all price data, currency, technical indicators, support, and resistance levels is August 28, 2024. The reference data in this report has been partly sourced from REFINITIV.
Note 3: Investment decisions should be made depending on an individual's appetite for upside potential, risks, holding duration, and any previous holdings. An 'Exit' from the stock can be considered if the Target Price mentioned as per the Valuation and or the technical levels provided has been achieved and is subject to the factors discussed above.
Note 4: The report publishing date is as per the Pacific Time Zone.
Technical Indicators Defined: -
Support: A level at which the stock prices tend to find support if they are falling, and a downtrend may take a pause backed by demand or buying interest. Support 1 refers to the nearby support level for the stock and if the price breaches the level, then Support 2 may act as the crucial support level for the stock.
Resistance: A level at which the stock prices tend to find resistance when they are rising, and an uptrend may take a pause due to profit booking or selling interest. Resistance 1 refers to the nearby resistance level for the stock and if the price surpasses the level, then Resistance 2 may act as the crucial resistance level for the stock.
Stop-loss: It is a level to protect against further losses in case of unfavorable movement in the stock prices.
This report has been issued by Kalkine Limited (Company number 07903332), a private limited company, incorporated in England and Wales ("Kalkine”). Kalkine.co.uk and associated pages are published by Kalkine. Kalkine is authorised and regulated by the Financial Conduct Authority under reference number 579414.
The information in this report and on the Kalkine website has been prepared from a wide variety of sources, which Kalkine, to the best of its knowledge and belief, considers accurate. Kalkine has made every effort to ensure the reliability of information contained in its reports, newsletters and websites. All information represents our views at the date of publication and may change without notice. The information in this report does not constitute an offer to sell securities or other financial products or a solicitation of an offer to buy securities or other financial products. Our reports contain non personalized recommendations to invest in securities and other financial products.
Kalkine does not offer financial advice based upon your personal financial situation or goals, and we shall not be held liable for any investment or trading losses you may incur by using the opinions expressed in our reports, publications, market updates, news alerts and corporate profiles. Kalkine does not intend to exclude any liability which it is not permitted to exclude under applicable law or regulation. Kalkine’s non-personalised advice does not in any way endorse or recommend individuals, investment products or services for your personal financial situation. You should discuss your portfolios and the risk tolerance level appropriate for your personal financial situation, with a professional authorised financial planner and adviser. You should be aware that the value of any investment and the income from it can go down as well as up and you may not get back the amount invested.
Please also read our Terms & Conditions for further information. Employees and/or associates of Kalkine and its related entities may hold interests in the securities or other financial products covered in this report or on the Kalkine website. Any such employees and associates are required to comply with certain safeguards, procedures and disclosures as required by law.
Kalkine Media Limited, an affiliate of Kalkine, may have received, or be entitled to receive, financial consideration in connection with providing information about certain entity(s) covered on its website including entities covered in this report.
 UK
UK  AU
AU CA
CA US
US NZ
NZ Please wait processing your request...