
Index Update: The FTSE 100 index, a key benchmark index for the London stock exchange, was trading rose around 0.18% on 23 March 2026.
Macro Update: The UK economy faces stagnant growth and a "higher-for-longer" interest rate environment, with the Bank of England holding rates at 3.75% due to rising energy costs. While manufacturing shows resilience, the dominant services sector remains flat. Rising unemployment and persistent inflation are currently offsetting recent rebounds in retail sales.
Top Market Movers: Among top gainers on FTSE 100 index, Croda International PLC (LSE: CRDA) witnessed a rise of 5.83% followed by Entain PLC (LSE:ENT) witnessed a rise of 5.55%.
Commodity Update: The U.S. dollar showed signs of a rebound on Monday as escalating tensions in the Middle East dampened risk appetite, supporting safe-haven demand. Meanwhile, commodities witnessed broad weakness, with gold dropping 4.79% to USD 4,389.40 and silver declining 6.56% to USD 65.10. Copper slipped 0.58%, while Brent crude remained nearly flat near USD 112.18 amid mixed signals around supply risks and easing sanctions on Iranian oil exports.
Our Stance: The UK economy remains resilient yet cautious. While manufacturing expands and retail recovers, stagnant services and 3.75% interest rates signal a "higher-for-longer" era. We prioritize monitoring inflationary energy shocks and rising unemployment, as these factors currently temper growth forecasts and delay much-anticipated Bank of England rate cuts.
FTSE 100: The FTSE 100 Index is trading near 9,717.91, down 2.02% as of March 23, 2026, and remains below its 20-day moving average near 10,404.15 and 50-day moving average near 10,361.04, indicating a weak short-term structure. The price action reflects a sharp decline following a prior uptrend, with recent candles showing accelerated downside pressure. Momentum has weakened further, with the RSI near 27.94, indicating oversold conditions. On the downside, 9,500–9,400 may act as a support zone, while 10,000–10,350 is likely to act as a resistance band, which may cap any near-term recovery attempts.
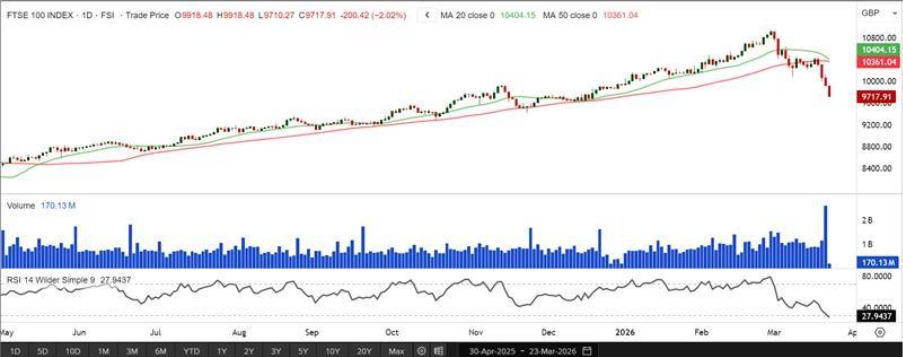
Source: Charts by EODHD/Others


 Please wait processing your request...